

Regulation of cell adhesion strength by peripheral focal adhesion distribution
- PMID: 22208188
- PMCID: PMC3244064
- DOI: 10.1016/j.bpj.2011.11.013
Regulation of cell adhesion strength by peripheral focal adhesion distribution
Abstract
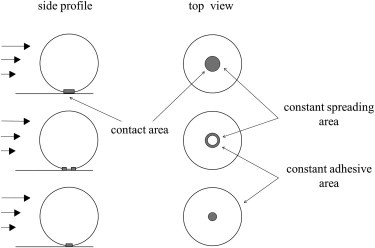
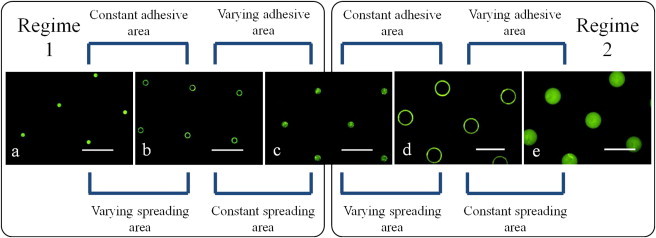
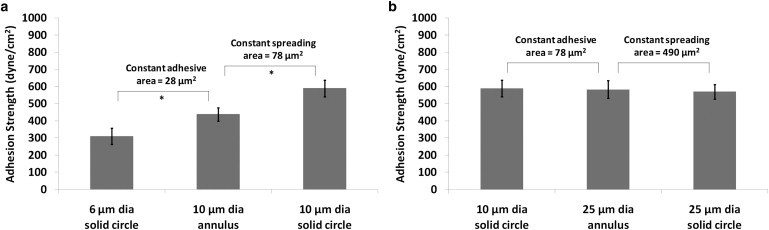
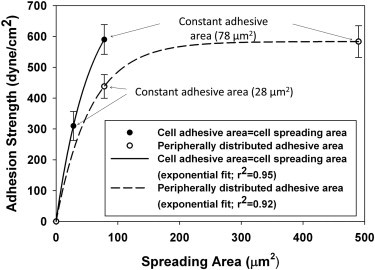
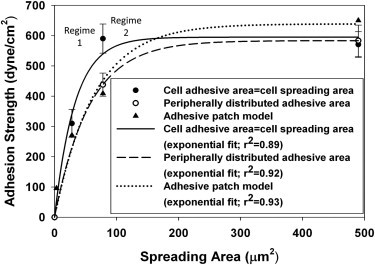
Cell adhesion to extracellular matrices is a tightly regulated process that involves the complex interplay between biochemical and mechanical events at the cell-adhesive interface. Previous work established the spatiotemporal contributions of adhesive components to adhesion strength and identified a nonlinear dependence on cell spreading. This study was designed to investigate the regulation of cell-adhesion strength by the size and position of focal adhesions (FA). The cell-adhesive interface was engineered to direct FA assembly to the periphery of the cell-spreading area to delineate the cell-adhesive area from the cell-spreading area. It was observed that redistributing the same adhesive area over a larger cell-spreading area significantly enhanced cell-adhesion strength, but only up to a threshold area. Moreover, the size of the peripheral FAs, which was interpreted as an adhesive patch, did not directly govern the adhesion strength. Interestingly, this is in contrast to the previously reported functional role of FAs in regulating cellular traction where sizes of the peripheral FAs play a critical role. These findings demonstrate, to our knowledge for the first time, that two spatial regimes in cell-spreading area exist that uniquely govern the structure-function role of FAs in regulating cell-adhesion strength.
Copyright © 2011 Biophysical Society. Published by Elsevier Inc. All rights reserved.
Figures
Similar articles
-
Cell adhesion strengthening: contributions of adhesive area, integrin binding, and focal adhesion assembly.Mol Biol Cell. 2005 Sep;16(9):4329-40. doi: 10.1091/mbc.e05-02-0170. Epub 2005 Jul 6. Mol Biol Cell. 2005. PMID: 16000373 Free PMC article.
-
Nanopatterning reveals an ECM area threshold for focal adhesion assembly and force transmission that is regulated by integrin activation and cytoskeleton tension.J Cell Sci. 2012 Nov 1;125(Pt 21):5110-23. doi: 10.1242/jcs.108035. Epub 2012 Aug 16. J Cell Sci. 2012. PMID: 22899715 Free PMC article.
-
Cell shape provides global control of focal adhesion assembly.Biochem Biophys Res Commun. 2003 Jul 25;307(2):355-61. doi: 10.1016/s0006-291x(03)01165-3. Biochem Biophys Res Commun. 2003. PMID: 12859964
-
Probing mechanical principles of focal contacts in cell-matrix adhesion with a coupled stochastic-elastic modelling framework.J R Soc Interface. 2011 Sep 7;8(62):1217-32. doi: 10.1098/rsif.2011.0157. Epub 2011 Jun 1. J R Soc Interface. 2011. PMID: 21632610 Free PMC article. Review.
-
Vinculin-p130Cas interaction is critical for focal adhesion dynamics and mechano-transduction.Cell Biol Int. 2014 Mar;38(3):283-6. doi: 10.1002/cbin.10204. Epub 2013 Nov 27. Cell Biol Int. 2014. PMID: 24497348 Review.
Cited by
-
Estrogens induce rapid cytoskeleton re-organization in human dermal fibroblasts via the non-classical receptor GPR30.PLoS One. 2015 Mar 17;10(3):e0120672. doi: 10.1371/journal.pone.0120672. eCollection 2015. PLoS One. 2015. PMID: 25781607 Free PMC article.
-
Elevated BMP and Mechanical Signaling Through YAP1/RhoA Poises FOP Mesenchymal Progenitors for Osteogenesis.J Bone Miner Res. 2019 Oct;34(10):1894-1909. doi: 10.1002/jbmr.3760. Epub 2019 Aug 19. J Bone Miner Res. 2019. PMID: 31107558 Free PMC article.
-
Differential detachment of intact and viable cells of different sizes using laser-induced microbubbles.Biomed Opt Express. 2019 Sep 4;10(10):4919-4930. doi: 10.1364/BOE.10.004919. eCollection 2019 Oct 1. Biomed Opt Express. 2019. PMID: 31646019 Free PMC article.
-
Allosteric activation of vinculin by talin.Nat Commun. 2023 Jul 18;14(1):4311. doi: 10.1038/s41467-023-39646-4. Nat Commun. 2023. PMID: 37463895 Free PMC article.
-
A switchable light-responsive azopolymer conjugating protein micropatterns with topography for mechanobiological studies.Front Bioeng Biotechnol. 2022 Jul 22;10:933410. doi: 10.3389/fbioe.2022.933410. eCollection 2022. Front Bioeng Biotechnol. 2022. PMID: 35935479 Free PMC article.
References
-
- Berrier A.L., Yamada K.M. Cell-matrix adhesion. J. Cell. Physiol. 2007;213:565–573. - PubMed
-
- Hynes R.O. Integrins: bidirectional, allosteric signaling machines. Cell. 2002;110:673–687. - PubMed
-
- García A.J., Huber F., Boettiger D. Force required to break α5β1 integrin-fibronectin bonds in intact adherent cells is sensitive to integrin activation state. J. Biol. Chem. 1998;273:10988–10993. - PubMed
-
- Geiger B., Bershadsky A., Yamada K.M. Transmembrane crosstalk between the extracellular matrix—cytoskeleton crosstalk. Nat. Rev. Mol. Cell Biol. 2001;2:793–805. - PubMed
Publication types
MeSH terms
Substances
LinkOut - more resources
Full Text Sources
Research Materials
Miscellaneous
