

Visual analysis of concerted cleavage by type IIF restriction enzyme SfiI in subsecond time region
- PMID: 22208198
- PMCID: PMC3244053
- DOI: 10.1016/j.bpj.2011.09.064
Visual analysis of concerted cleavage by type IIF restriction enzyme SfiI in subsecond time region
Abstract
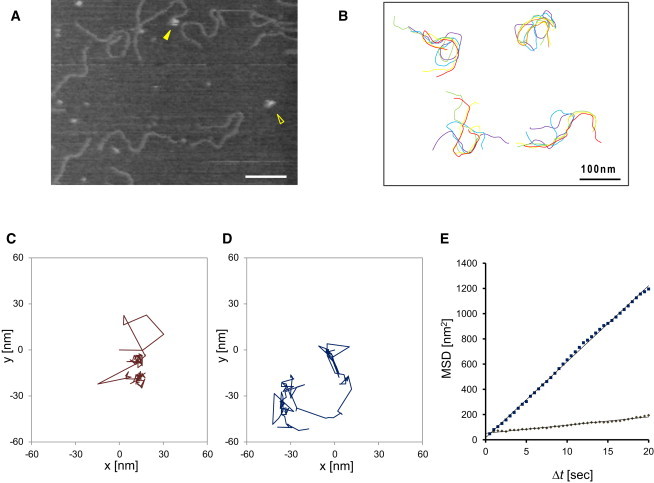
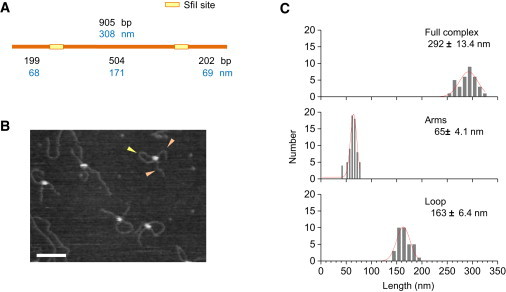
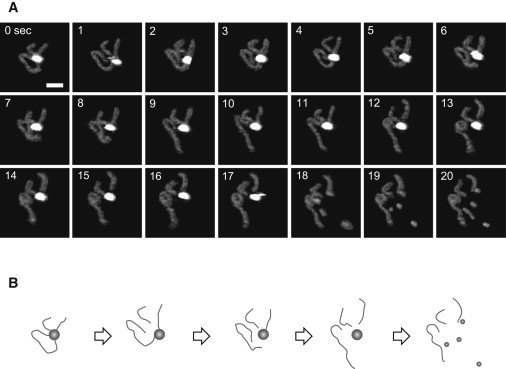
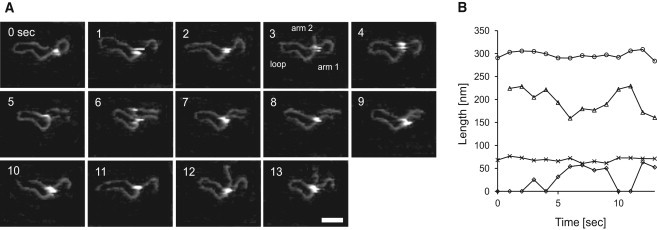
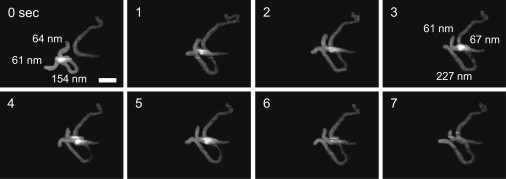
Many DNA regulatory factors require communication between distantly separated DNA sites for their activity. The type IIF restriction enzyme SfiI is often used as a model system of site communication. Here, we used fast-scanning atomic force microscopy to monitor the DNA cleavage process with SfiI and the changes in the single SfiI-DNA complex in the presence of either Mg²⁺ or Ca²⁺ at a scan rate of 1-2 fps. The increased time resolution allowed us to visualize the concerted cleavage of the protein at two cognate sites. The four termini generated by the cleavage were released in a multistep manner. The high temporal resolution enabled us to visualize the translocation of a DNA strand on a looped complex and intersegmental transfer of the SfiI protein in which swapping of the site is performed without protein dissociation. On the basis of our results, we propose that the SfiI tetramer can remain bound to one of the sites even after cleavage, allowing the other site on the DNA molecule to fill the empty DNA-binding cleft by combining a one-dimensional diffusion-mediated sliding and a segment transfer mechanism.
Copyright © 2011 Biophysical Society. Published by Elsevier Inc. All rights reserved.
Figures
Similar articles
-
Fast-scanning atomic force microscopy reveals the molecular mechanism of DNA cleavage by ApaI endonuclease.IEE Proc Nanobiotechnol. 2006 Aug;153(4):60-6. doi: 10.1049/ip-nbt:20050018. IEE Proc Nanobiotechnol. 2006. PMID: 16948489
-
Dynamics of synaptic SfiI-DNA complex: single-molecule fluorescence analysis.Biophys J. 2007 May 1;92(9):3241-50. doi: 10.1529/biophysj.106.095778. Epub 2007 Feb 2. Biophys J. 2007. PMID: 17277188 Free PMC article.
-
A homology model of restriction endonuclease SfiI in complex with DNA.BMC Struct Biol. 2005 Jan 24;5:2. doi: 10.1186/1472-6807-5-2. BMC Struct Biol. 2005. PMID: 15667656 Free PMC article.
-
Fidelity of DNA sequence recognition by the SfiI restriction endonuclease is determined by communications between its two DNA-binding sites.J Mol Biol. 2008 Dec 19;384(3):557-63. doi: 10.1016/j.jmb.2008.09.057. Epub 2008 Oct 2. J Mol Biol. 2008. PMID: 18848951
-
Probing Interactions within the synaptic DNA-SfiI complex by AFM force spectroscopy.J Mol Biol. 2007 Feb 2;365(5):1407-16. doi: 10.1016/j.jmb.2006.10.041. Epub 2006 Oct 17. J Mol Biol. 2007. PMID: 17125791 Free PMC article.
Cited by
-
Visualization of conformational variability in the domains of long single-stranded RNA molecules.Nucleic Acids Res. 2017 Aug 21;45(14):8493-8507. doi: 10.1093/nar/gkx502. Nucleic Acids Res. 2017. PMID: 28591846 Free PMC article.
-
High-speed atomic force microscopy combined with inverted optical microscopy for studying cellular events.Sci Rep. 2013;3:2131. doi: 10.1038/srep02131. Sci Rep. 2013. PMID: 23823461 Free PMC article.
-
Assembly of Synaptic Protein-DNA Complexes: Critical Role of Non-Specific Interactions.Int J Mol Sci. 2023 Jun 6;24(12):9800. doi: 10.3390/ijms24129800. Int J Mol Sci. 2023. PMID: 37372946 Free PMC article.
-
Viral RNA recognition by LGP2 and MDA5, and activation of signaling through step-by-step conformational changes.Nucleic Acids Res. 2020 Nov 18;48(20):11664-11674. doi: 10.1093/nar/gkaa935. Nucleic Acids Res. 2020. PMID: 33137199 Free PMC article.
-
Imaging of DNA and Protein-DNA Complexes with Atomic Force Microscopy.Crit Rev Eukaryot Gene Expr. 2016;26(1):63-96. doi: 10.1615/CritRevEukaryotGeneExpr.v26.i1.70. Crit Rev Eukaryot Gene Expr. 2016. PMID: 27278886 Free PMC article. Review.
References
-
- Ellis D.J., Dryden D.T., Henderson R.M. Direct observation of DNA translocation and cleavage by the EcoKI endonuclease using atomic force microscopy. Nat. Struct. Biol. 1999;6:15–17. - PubMed
Publication types
MeSH terms
Substances
LinkOut - more resources
Full Text Sources
Other Literature Sources
Molecular Biology Databases
Miscellaneous
