

Opposite GC skews at the 5' and 3' ends of genes in unicellular fungi
- PMID: 22208287
- PMCID: PMC3315797
- DOI: 10.1186/1471-2164-12-638
Opposite GC skews at the 5' and 3' ends of genes in unicellular fungi
Abstract
Background: GC-skews have previously been linked to transcription in some eukaryotes. They have been associated with transcription start sites, with the coding strand G-biased in mammals and C-biased in fungi and invertebrates.
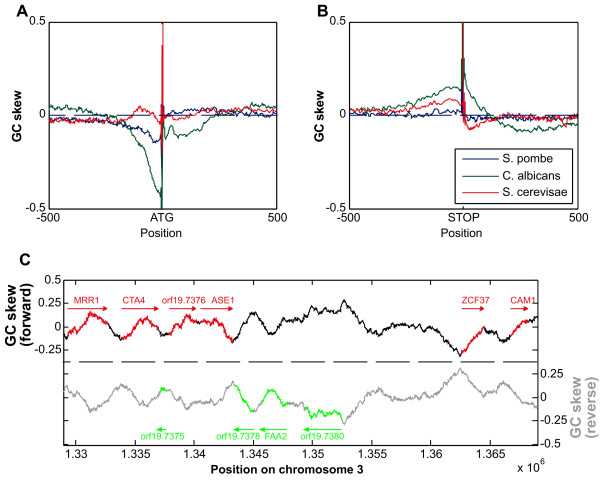
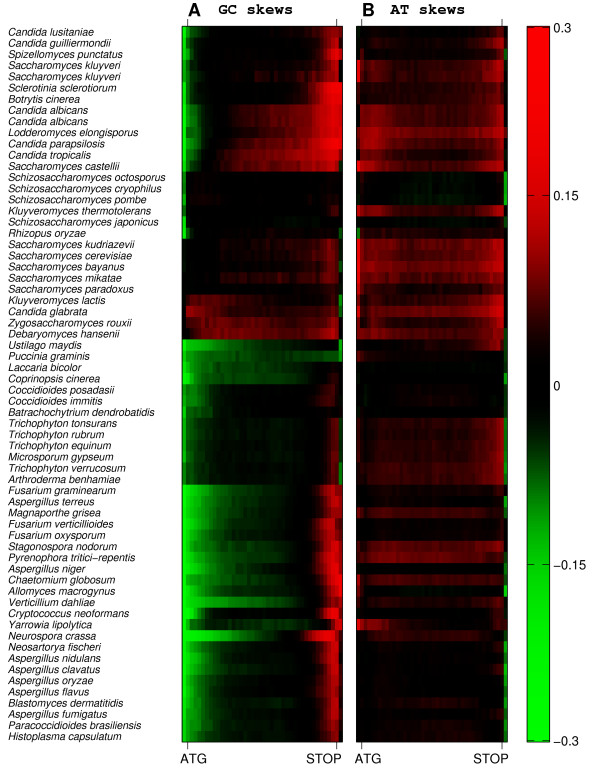
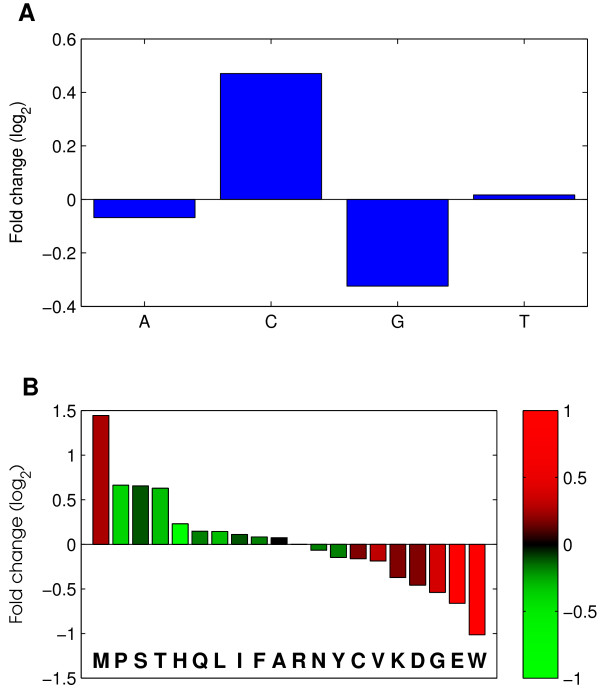
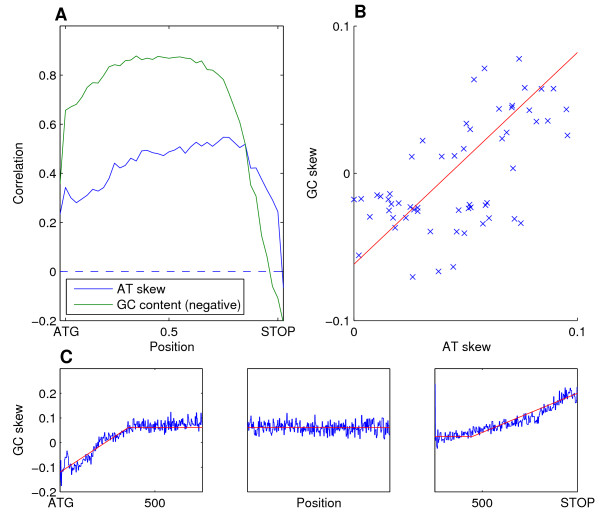
Results: We show a consistent and highly significant pattern of GC-skew within genes of almost all unicellular fungi. The pattern of GC-skew is asymmetrical: the coding strand of genes is typically C-biased at the 5' ends but G-biased at the 3' ends, with intermediate skews at the middle of genes. Thus, the initiation, elongation, and termination phases of transcription are associated with different skews. This pattern influences the encoded proteins by generating differential usage of amino acids at the 5' and 3' ends of genes. These biases also affect fourfold-degenerate positions and extend into promoters and 3' UTRs, indicating that skews cannot be accounted by selection for protein function or translation.
Conclusions: We propose two explanations, the mutational pressure hypothesis, and the adaptive hypothesis. The mutational pressure hypothesis is that different co-factors bind to RNA pol II at different phases of transcription, producing different mutational regimes. The adaptive hypothesis is that cytidine triphosphate deficiency may lead to C-avoidance at the 3' ends of transcripts to control the flow of RNA pol II molecules and reduce their frequency of collisions.
Figures
Similar articles
-
GC-compositional strand bias around transcription start sites in plants and fungi.BMC Genomics. 2005 Feb 28;6:26. doi: 10.1186/1471-2164-6-26. BMC Genomics. 2005. PMID: 15733327 Free PMC article.
-
Asymmetry indices for analysis and prediction of replication origins in eukaryotic genomes.PLoS One. 2012;7(9):e45050. doi: 10.1371/journal.pone.0045050. Epub 2012 Sep 27. PLoS One. 2012. PMID: 23028755 Free PMC article.
-
Evidence that RNA polymerase II and not TFIIB is responsible for the difference in transcription initiation patterns between Saccharomyces cerevisiae and Schizosaccharomyces pombe.Nucleic Acids Res. 2012 Aug;40(14):6495-507. doi: 10.1093/nar/gks323. Epub 2012 Apr 17. Nucleic Acids Res. 2012. PMID: 22510268 Free PMC article.
-
Genome-wide RNA polymerase II: not genes only!Trends Biochem Sci. 2008 Jun;33(6):265-73. doi: 10.1016/j.tibs.2008.04.006. Epub 2008 May 6. Trends Biochem Sci. 2008. PMID: 18467100 Review.
-
Basic mechanisms of RNA polymerase II activity and alteration of gene expression in Saccharomyces cerevisiae.Biochim Biophys Acta. 2013 Jan;1829(1):39-54. doi: 10.1016/j.bbagrm.2012.09.007. Epub 2012 Sep 26. Biochim Biophys Acta. 2013. PMID: 23022618 Free PMC article. Review.
Cited by
-
S1-DRIP-seq identifies high expression and polyA tracts as major contributors to R-loop formation.Genes Dev. 2016 Jun 1;30(11):1327-38. doi: 10.1101/gad.280834.116. Genes Dev. 2016. PMID: 27298336 Free PMC article.
-
The First Five Mitochondrial Genomes for the Family Nidulariaceae Reveal Novel Gene Rearrangements, Intron Dynamics, and Phylogeny of Agaricales.Int J Mol Sci. 2023 Aug 9;24(16):12599. doi: 10.3390/ijms241612599. Int J Mol Sci. 2023. PMID: 37628782 Free PMC article.
-
Characterization and phylogenetic analysis of the complete mitochondrial genome of the medicinal fungus Laetiporus sulphureus.Sci Rep. 2018 Jun 14;8(1):9104. doi: 10.1038/s41598-018-27489-9. Sci Rep. 2018. PMID: 29904057 Free PMC article.
References
-
- Chargaff E. Structure and function of nucleic acids as cell constituents. Federation proceedings. 1951;10:654–659. - PubMed
Publication types
MeSH terms
Substances
LinkOut - more resources
Full Text Sources
Medical
Molecular Biology Databases
Miscellaneous
