

Non-stem cancer cell kinetics modulate solid tumor progression
- PMID: 22208390
- PMCID: PMC3285090
- DOI: 10.1186/1742-4682-8-48
Non-stem cancer cell kinetics modulate solid tumor progression
Abstract
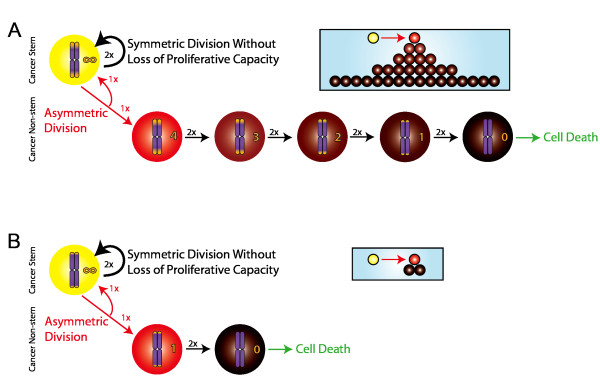
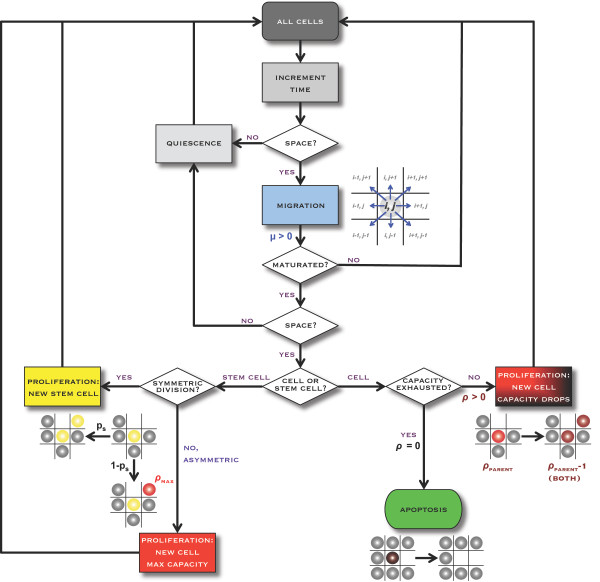
Background: Solid tumors are heterogeneous in composition. Cancer stem cells (CSCs) are believed to drive tumor progression, but the relative frequencies of CSCs versus non-stem cancer cells span wide ranges even within tumors arising from the same tissue type. Tumor growth kinetics and composition can be studied through an agent-based cellular automaton model using minimal sets of biological assumptions and parameters. Herein we describe a pivotal role for the generational life span of non-stem cancer cells in modulating solid tumor progression in silico.
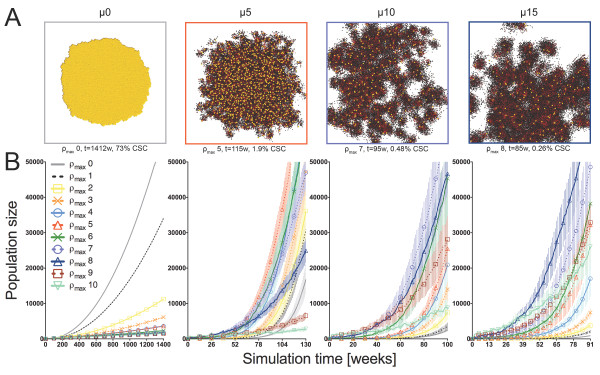
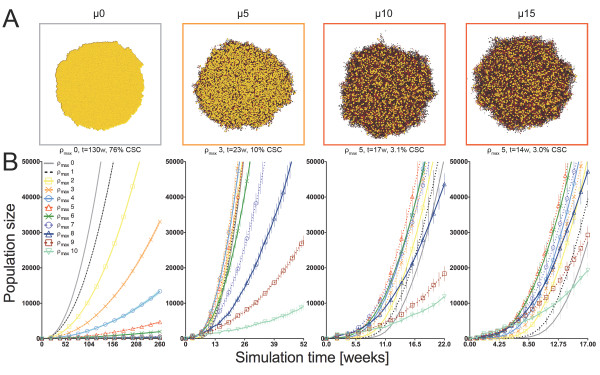
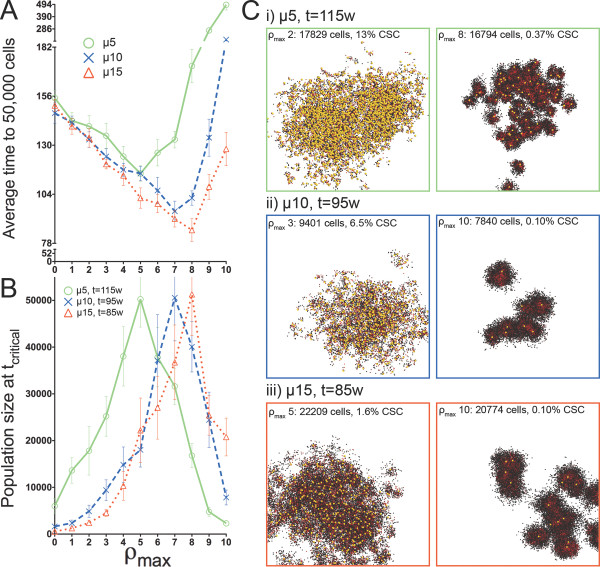
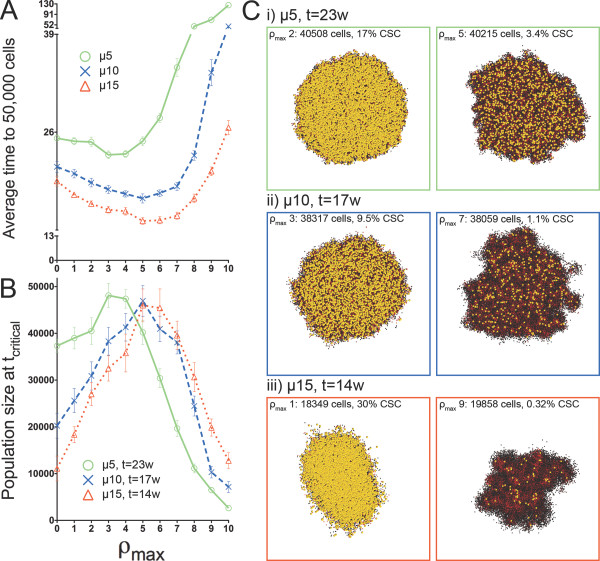
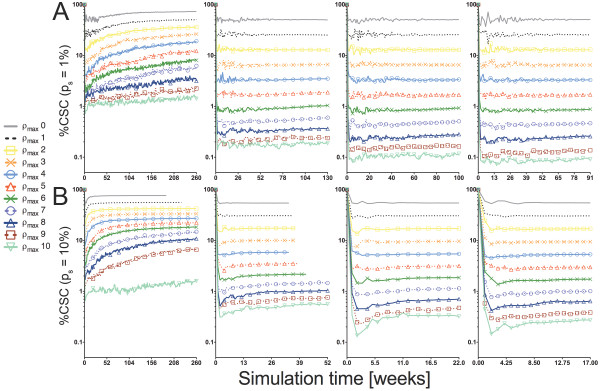
Results: We demonstrate that although CSCs are necessary for progression, their expansion and consequently tumor growth kinetics are surprisingly modulated by the dynamics of the non-stem cancer cells. Simulations reveal that slight variations in non-stem cancer cell proliferative capacity can result in tumors with distinctly different growth kinetics. Longer generational life spans yield self-inhibited tumors, as the emerging population of non-stem cancer cells spatially impedes expansion of the CSC compartment. Conversely, shorter generational life spans yield persistence-limited tumors, with symmetric division frequency of CSCs determining tumor growth rate. We show that the CSC fraction of a tumor population can vary by multiple orders of magnitude as a function of the generational life span of the non-stem cancer cells.
Conclusions: Our study suggests that variability in the growth rate and CSC content of solid tumors may be, in part, attributable to the proliferative capacity of the non-stem cancer cell population that arises during asymmetric division of CSCs. In our model, intermediate proliferative capacities give rise to the fastest-growing tumors, resulting in self-metastatic expansion driven by a balance between symmetric CSC division and expansion of the non-stem cancer population. Our results highlight the importance of non-stem cancer cell dynamics in the CSC hypothesis, and may offer a novel explanation for the large variations in CSC fractions reported in vivo.
Figures
Similar articles
-
Cancer Stem Cells: A Minor Cancer Subpopulation that Redefines Global Cancer Features.Front Oncol. 2013 Apr 15;3:76. doi: 10.3389/fonc.2013.00076. eCollection 2013. Front Oncol. 2013. PMID: 23596563 Free PMC article.
-
A simple mathematical model based on the cancer stem cell hypothesis suggests kinetic commonalities in solid tumor growth.PLoS One. 2012;7(2):e26233. doi: 10.1371/journal.pone.0026233. Epub 2012 Feb 17. PLoS One. 2012. PMID: 22363395 Free PMC article.
-
Cancer stem cell, niche and EGFR decide tumor development and treatment response: A bio-computational simulation study.J Theor Biol. 2011 Jan 21;269(1):138-49. doi: 10.1016/j.jtbi.2010.10.016. Epub 2010 Oct 20. J Theor Biol. 2011. PMID: 20969880 Free PMC article.
-
Cancer stem cells (CSCs) in cancer progression and therapy.J Cell Physiol. 2019 Jun;234(6):8381-8395. doi: 10.1002/jcp.27740. Epub 2018 Nov 11. J Cell Physiol. 2019. PMID: 30417375 Review.
-
Die hard: are cancer stem cells the Bruce Willises of tumor biology?Cytometry A. 2009 Jan;75(1):67-74. doi: 10.1002/cyto.a.20690. Cytometry A. 2009. PMID: 19051297 Review.
Cited by
-
Treatment Analysis in a Cancer Stem Cell Context Using a Tumor Growth Model Based on Cellular Automata.PLoS One. 2015 Jul 15;10(7):e0132306. doi: 10.1371/journal.pone.0132306. eCollection 2015. PLoS One. 2015. PMID: 26176702 Free PMC article.
-
Microenvironmental variables must influence intrinsic phenotypic parameters of cancer stem cells to affect tumourigenicity.PLoS Comput Biol. 2014 Jan;10(1):e1003433. doi: 10.1371/journal.pcbi.1003433. Epub 2014 Jan 16. PLoS Comput Biol. 2014. PMID: 24453958 Free PMC article.
-
A multicompartment mathematical model of cancer stem cell-driven tumor growth dynamics.Bull Math Biol. 2014 Jul;76(7):1762-82. doi: 10.1007/s11538-014-9976-0. Epub 2014 May 20. Bull Math Biol. 2014. PMID: 24840956 Free PMC article.
-
In silico study of the impact of cancer stem cell dynamics and radiobiological hypoxia on tumour response to hyperfractionated radiotherapy.Cell Prolif. 2016 Jun;49(3):304-14. doi: 10.1111/cpr.12251. Epub 2016 Apr 15. Cell Prolif. 2016. PMID: 27079860 Free PMC article.
-
Evolution and phenotypic selection of cancer stem cells.PLoS Comput Biol. 2015 Mar 5;11(3):e1004025. doi: 10.1371/journal.pcbi.1004025. eCollection 2015 Mar. PLoS Comput Biol. 2015. PMID: 25742563 Free PMC article.
References
Publication types
MeSH terms
Grants and funding
LinkOut - more resources
Full Text Sources
