. 2012 Mar;60(1):633-43.
doi: 10.1016/j.neuroimage.2011.12.025. Epub 2011 Dec 22.

Using brain imaging to track problem solving in a complex state space

Affiliations

Using brain imaging to track problem solving in a complex state space

John R Anderson et al. Neuroimage. 2012 Mar.

Abstract

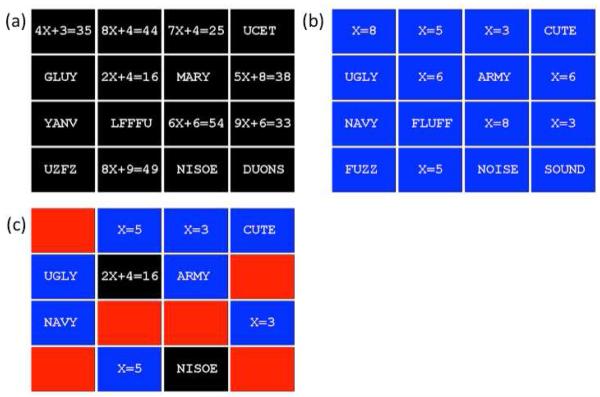
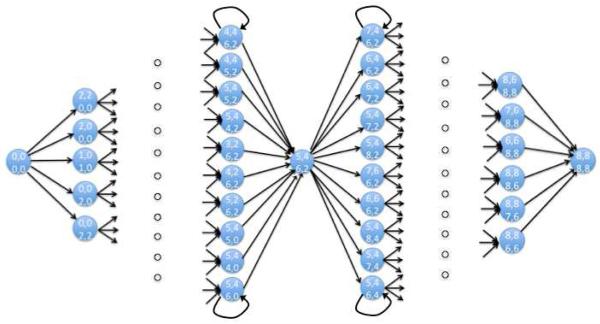
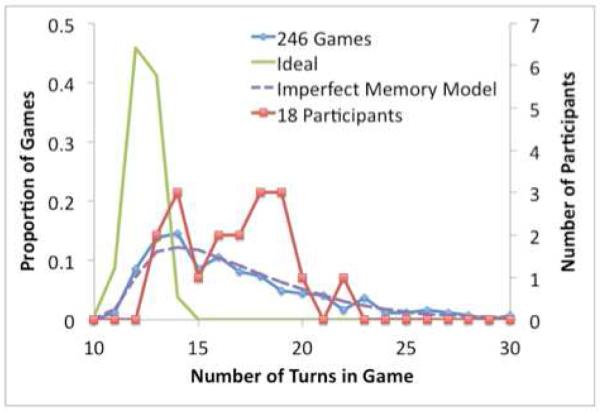
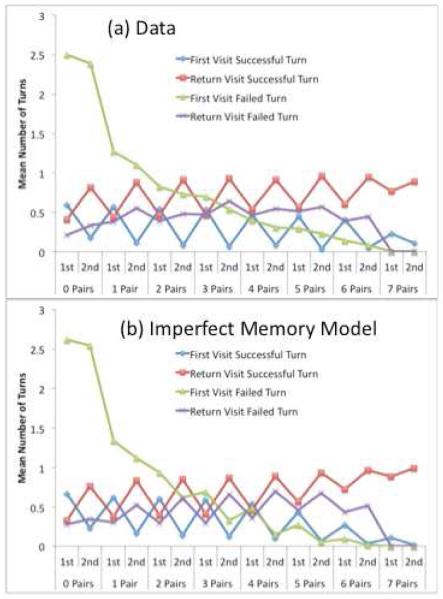
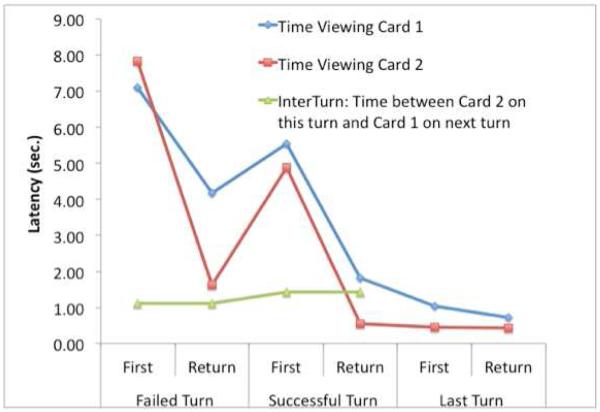
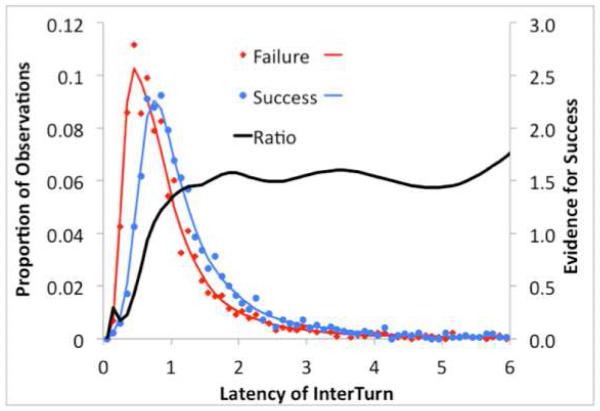
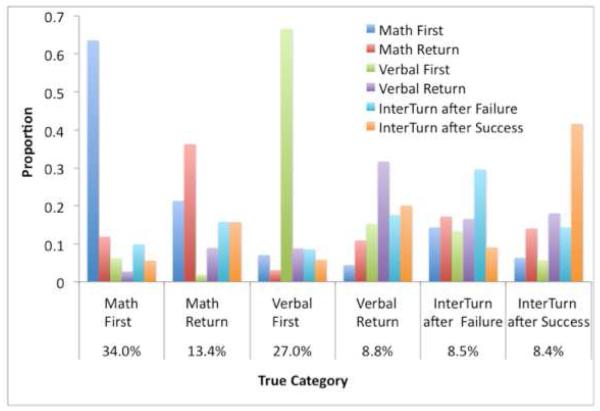
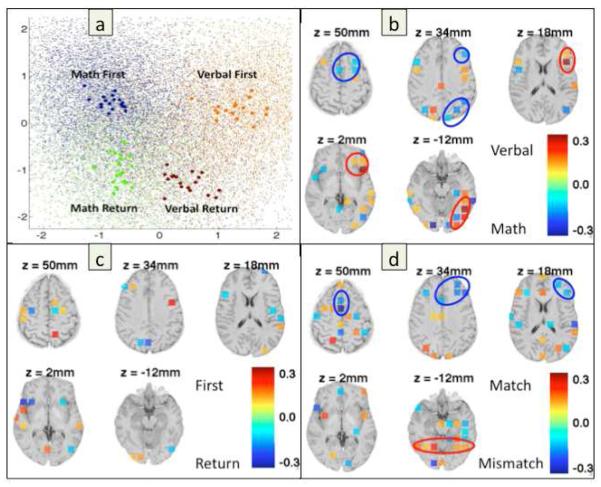
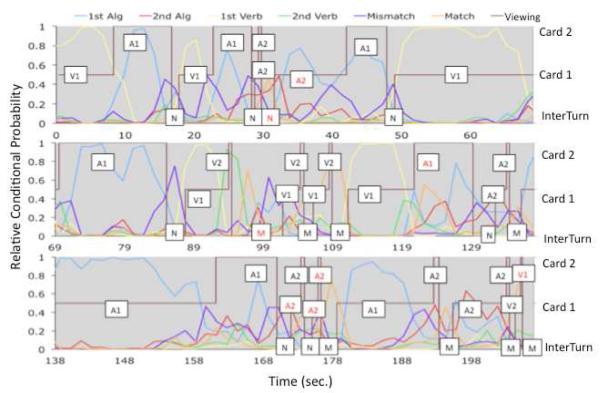
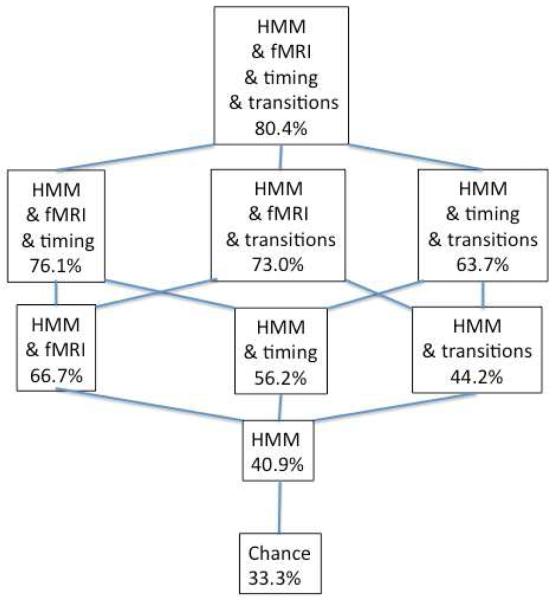
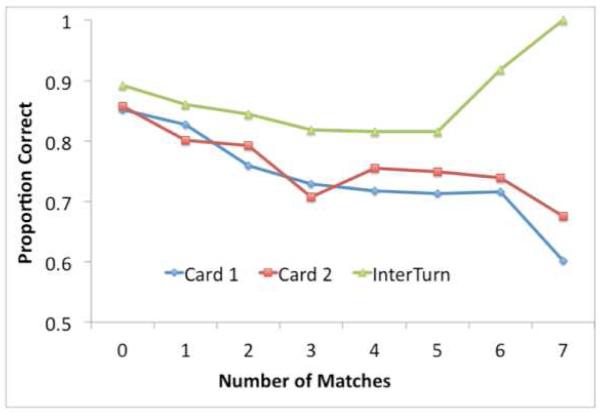
This paper describes how behavioral and imaging data can be combined with a Hidden Markov Model (HMM) to track participants' trajectories through a complex state space. Participants completed a problem-solving variant of a memory game that involved 625 distinct states, 24 operators, and an astronomical number of paths through the state space. Three sources of information were used for classification purposes. First, an Imperfect Memory Model was used to estimate transition probabilities for the HMM. Second, behavioral data provided information about the timing of different events. Third, multivoxel pattern analysis of the imaging data was used to identify features of the operators. By combining the three sources of information, an HMM algorithm was able to efficiently identify the most probable path that participants took through the state space, achieving over 80% accuracy. These results support the approach as a general methodology for tracking mental states that occur during individual problem-solving episodes.


Figures

Figure 1
Figure 1
Sample illustrations of the memory game. The locations and identities of the algebra equations and anagrams are shown in A and the corresponding solutions are shown in B. During game play, a problem was not shown until its card was selected and a solution was not shown until its card was matched. Unselected and unmatched cards appeared in red with no text. An example of what the game display might look like for a participant about halfway through a game is shown in C. For a full video reproduction of a game played by an actual participant, see http://act-r.psy.cmu.edu/publications/pubinfo.php?id=993.
Figure 2
Figure 2
An illustration of a fragment of the state space for the memory game. Each circle represents one of the states – 34 of the 625 states are represented. The four digits in each state reflect the number of visited math cards, the number of matched math cards, the number of visited verbal cards, and the number of matched verbal cards. The state space is shown as beginning with the state of no cards matched, passing through some of the states with cards matched, and ending in a state with all cards matched.
Figure 3
Figure 3
Distributions of the number of turns. See discussion in text.
Figure 4
Figure 4
(a) Number of times different types of cards are viewed as a function of how many cards have been matched and whether it is the first or second card. (b) Predictions of the Imperfect Memory Model.
Figure 5
Figure 5
Mean times for various events, classified by whether they involve viewing Card 1, viewing Card 2, or are the subsequent InterTurn. Data are also divided according to whether it was a failed turn versus a successful turn and whether it was a first visit or a return visit. Data for the last turn of the game are plotted separately.
Figure 6
Figure 6
An illustration of how the exact latencies provide evidence about an event, even in a case like this where the mean failure and success times for InterTurns are similar (see Figure 5). The ”Ratio” line is the ratio between the empirical densities for failures and successes.
Figure 7
Figure 7
Ability of the linear discriminant function to distinguish among categories. The x-axis gives the various categories and proportion of scans from that category. The bars for each category show the proportion of scans in each category assigned to each of the six possible categories. Information sufficient to recreate this analysis is available in the files available at http://act-r.psy.cmu.edu/publications/pubinfo.php?id=993.
Figure 8
Figure 8
(a) Representation of the two dimensions in the projection of the LDA for the four categories: first visit to a math card (blue), return visit to a math card (green), first visit to a verbal card (orange), and return visit to a verbal card (brown). Large dots represent mean participant values and small dots individual scans. (b) Regions with strong weightings on the first dimension that reflects the math versus verbal dimension. (c) Regions with strong weightings on the second dimension that reflects the first versus return visit dimension. (d) Regions with strong weightings in the LDA for discriminating between InterTurns after matching a pair and InterTurns after mismatching. See text for further discussion.
Figure 9
Figure 9
An example of classification performance for a single game. The brown line indicates whether the participant was viewing Card 1, Card 2, or InterTurn (value 0). The other lines show the relative evidence from the classifier for the 6 interpretations of a turn. The symbols in the boxes indicate the true identity of the event: V1 = first visit to a verbal card, V2 = return visit to a verbal card, A1 = first visit to a math (algebra) card, A2 = return visit to a math card, N = nonmatch, and M = Match. Symbols in red are cases that the algorithm failed to classify correctly.
Figure 10
Figure 10
An illustration of the contributions of different sources of information to the success of classification. Information sufficient to recreate this analysis is available in the files available at http://act-r.psy.cmu.edu/publications/pubinfo.php?id=993.
Figure 11
Figure 11
Accuracy in classification as a function of number of matches.

References

    1. Anderson JR. Human symbol manipulation within an integrated cognitive architecture. Cognitive Science. 2005;29:313–342. - PubMed
    1. Anderson JR. Tracking problem solving by multivariate pattern analysis and hidden markov model algorithms. Neuropsychologia. (in press) - PMC - PubMed
    1. Anderson JR, Betts S, Ferris JL, Fincham JM. Neural imaging to track mental states while using an intelligent tutoring system. Proceedings of the National Academy of Science, USA. 2010;107:7018–7023. - PMC - PubMed
    1. Anderson JR, Betts S, Ferris JL, Fincham JM. Cognitive and metacognitive activity in mathematical problem solving: Prefrontal and parietal patterns. Cognitive, Affective, and Behavioral Neuroscience. 2011;11:52–67. - PMC - PubMed
    1. Anderson JR, Betts S, Ferris JL, Fincham JM. Tracking children’s mental states while solving algebra equations. Human Brain Mapping. (in press) - PMC - PubMed

Publication types