. 2012 Apr;190(4):1417-32.
doi: 10.1534/genetics.111.137794. Epub 2011 Dec 29.

Ecological genomics of Anopheles gambiae along a latitudinal cline: a population-resequencing approach

Affiliations

Ecological genomics of Anopheles gambiae along a latitudinal cline: a population-resequencing approach

Changde Cheng et al. Genetics. 2012 Apr.

Abstract

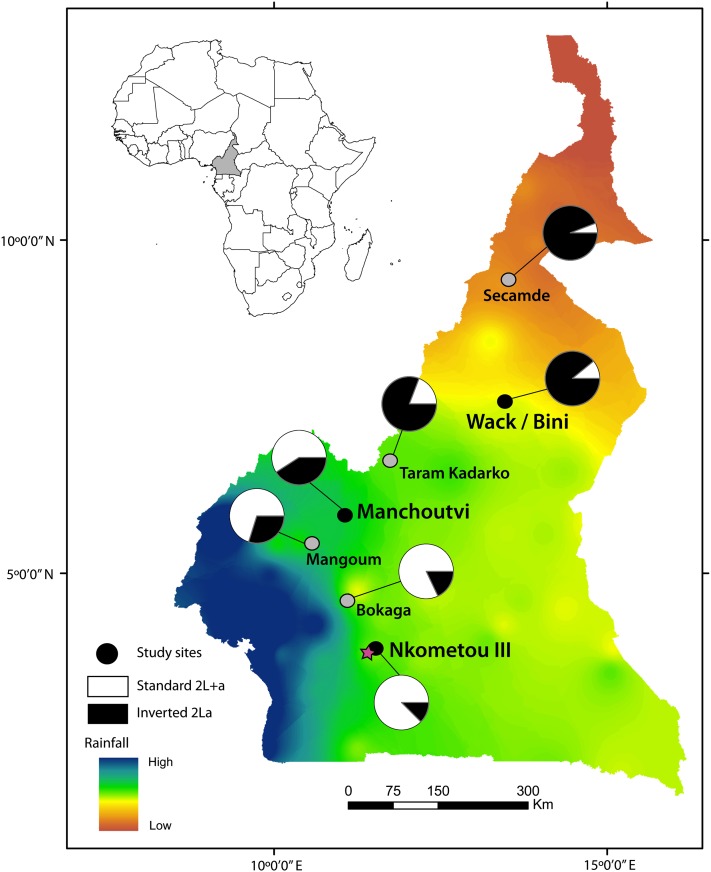
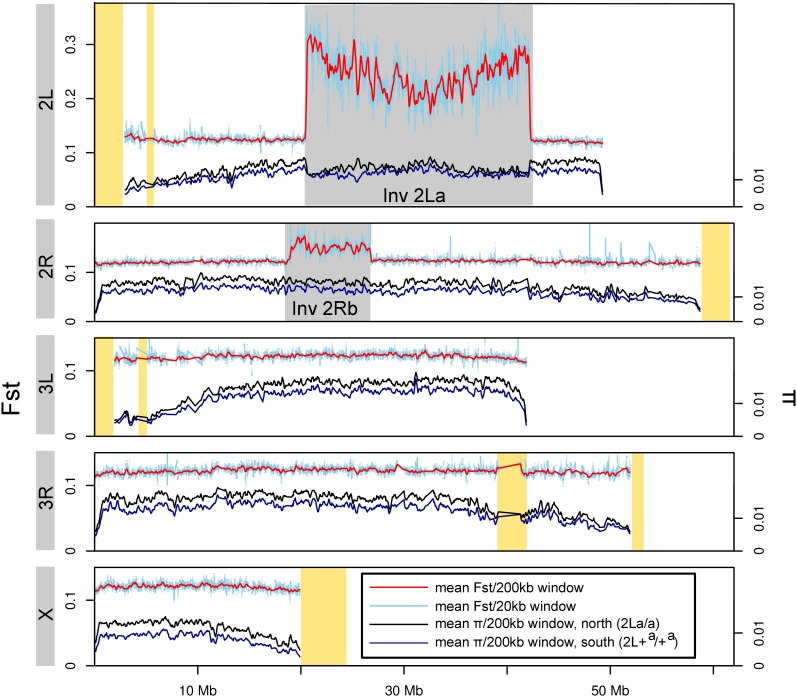
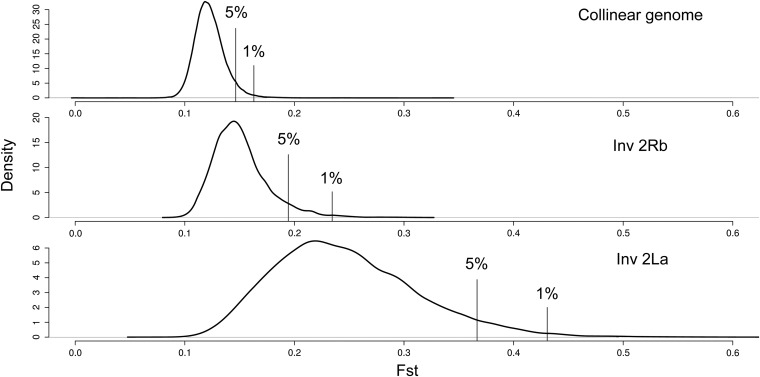
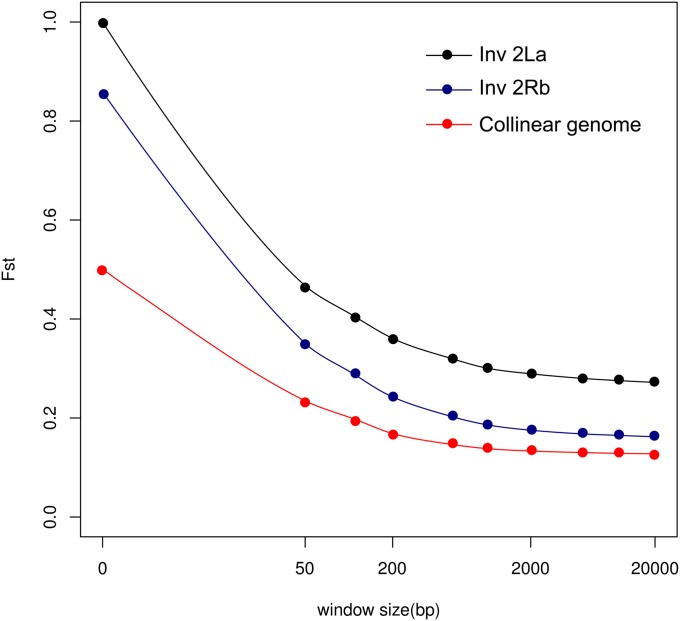
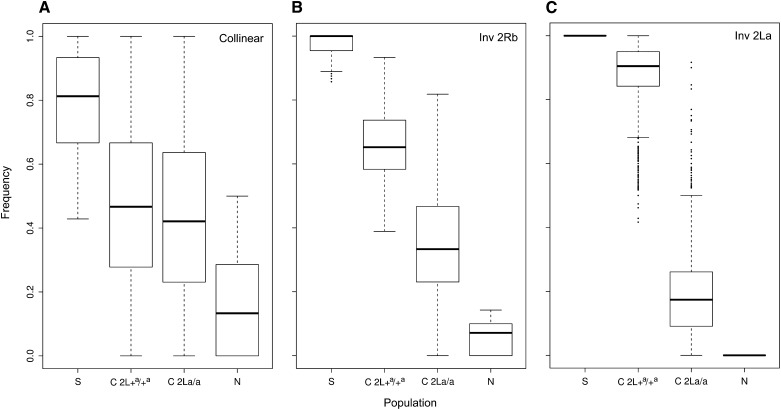
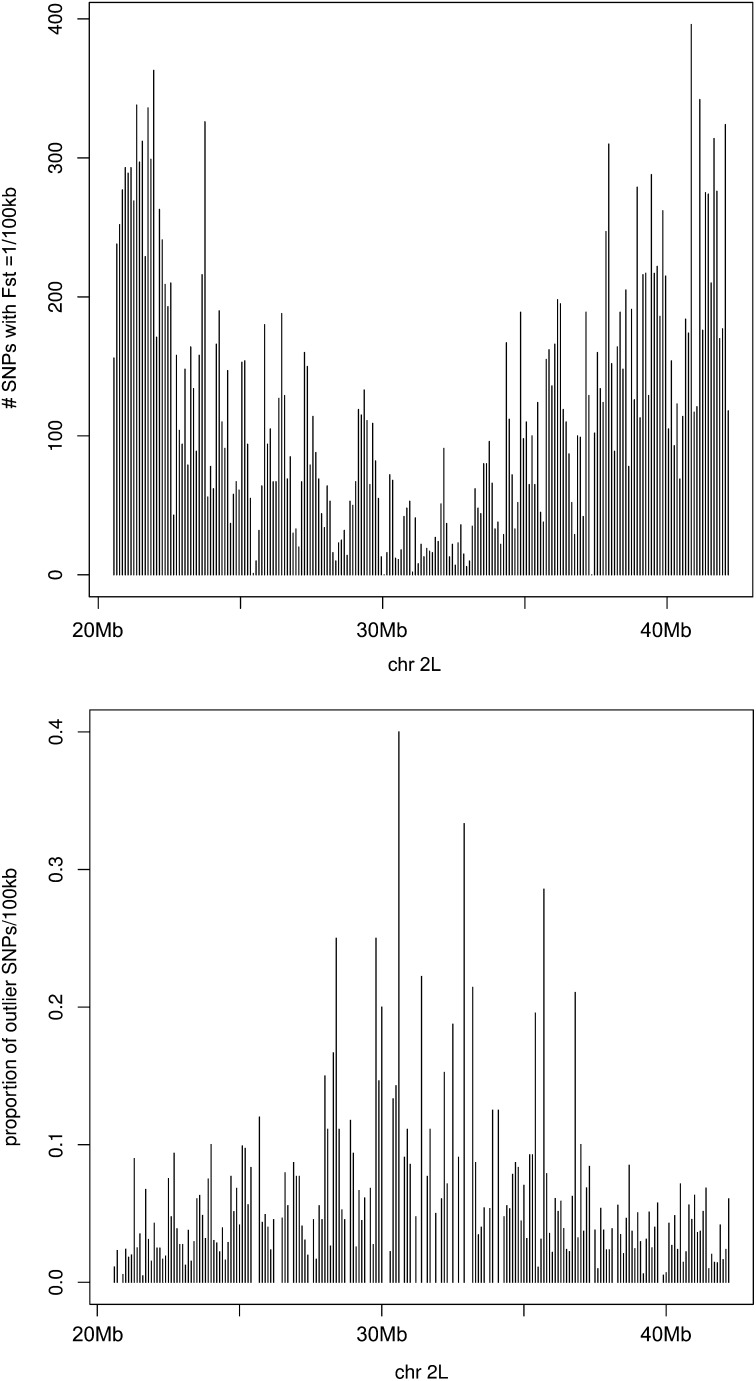
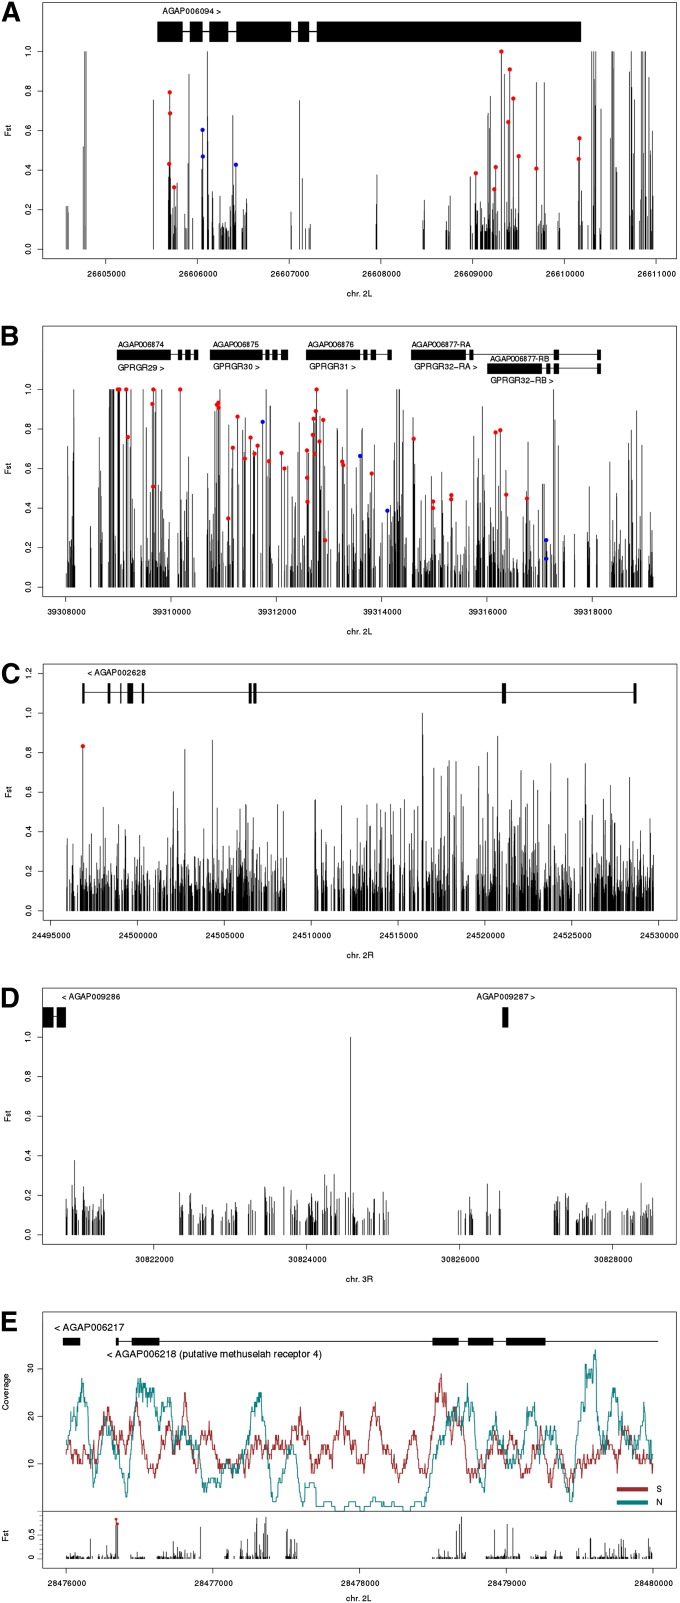
The association between fitness-related phenotypic traits and an environmental gradient offers one of the best opportunities to study the interplay between natural selection and migration. In cases in which specific genetic variants also show such clinal patterns, it may be possible to uncover the mutations responsible for local adaptation. The malaria vector, Anopheles gambiae, is associated with a latitudinal cline in aridity in Cameroon; a large inversion on chromosome 2L of this mosquito shows large differences in frequency along this cline, with high frequencies of the inverted karyotype present in northern, more arid populations and an almost complete absence of the inverted arrangement in southern populations. Here we use a genome resequencing approach to investigate patterns of population divergence along the cline. By sequencing pools of individuals from both ends of the cline as well as in the center of the cline- where the inversion is present in intermediate frequency- we demonstrate almost complete panmixia across collinear parts of the genome and high levels of differentiation in inverted parts of the genome. Sequencing of separate pools of each inversion arrangement in the center of the cline reveals large amounts of gene flux (i.e., gene conversion and double crossovers) even within inverted regions, especially away from the inversion breakpoints. The interplay between natural selection, migration, and gene flux allows us to identify several candidate genes responsible for the match between inversion frequency and environmental variables. These results, coupled with similar conclusions from studies of clinal variation in Drosophila, point to a number of important biological functions associated with local environmental adaptation.


Figures

Figure 1
Figure 1
Sampling sites along a latitudinal transect in Cameroon. Mean annual precipitation, from high (blue) to low (orange), is based on data from FAO SDdimensions (http://www.fao.org/sd/2002/EN1203a_en.htm). Pies show the frequency of the standard (2L+a, white) and inverted (2La, black) arrangement of inversion 2La in An. gambiae S populations sampled at each locality (circles). Black circles indicate the three localities chosen for population resequencing. The capital Yaoundé is represented by a star.
Figure 2
Figure 2
Divergence (FST) between and diversity (π) within An. gambiae S populations from opposite ends of the latitudinal cline in Cameroon. Across each chromosome arm, mean divergence is plotted over 200-kb windows slid every 50 kb (red), and 20-kb windows slid every 5 kb (light blue). Mean diversity is plotted for 200-kb windows slid every 50 kb for Nkoumetu in the south (2La/a; dark blue) and Wack/Bini in the north (2L+a/+a; black). Gray and yellow shaded boxes indicate chromosomal rearrangements or heterochromatic regions, respectively. Only windows containing ≥317 sites meeting coverage thresholds are plotted, causing reduced representation of heterochromatic regions.
Figure 3
Figure 3
Distribution of FST values for 1-kb windows spanning the collinear euchromatic genome, the 2Rb and the 2La rearrangements (between north and south populations). Positions in the distributions marking the top 5% and top 1% FST values are indicated by vertical lines.
Figure 4
Figure 4
The decay of average FST with increasing window size for windows centered on the most differentiated SNPs between northern and southern Cameroon populations in the collinear genome (red), the 2Rb rearrangement (blue), and the 2La rearrangement (black). Note that the x-axis is on a logarithmic scale.
Figure 5
Figure 5
Individual SNP frequencies along the latitudinal gradient in Cameroon, based on loci that most strongly differentiated populations at opposite ends of the gradient. Frequencies are plotted with respect to the allele predominating in the southern population in (A) the collinear genome, (B) the 2Rb rearrangement, and (C) the 2La –75th percentile); the horizontal line marks the median. Upper (lower) whiskers include the maximum (minimum) values unless the distance from the first (third) quartile exceeds 1.5× that of the IQR. Outlier values smaller or larger than the whiskers are indicated by dots. N, northern population; S, southern population; C, central population, partitioned by karyotype into 2La/a and 2L+a/+a homozygotes.
Figure 6
Figure 6
The position and density of SNPs inside the 2La rearrangement with fixed differences between 2La and 2L+a at opposite ends of the cline. Counts are based on nonoverlapping 100-kb windows slid between the breakpoints of 2La. Top: The total set of SNPs with FST = 1 between northern and southern populations. Bottom: The outlier SNPs in the central 2La/a and 2L+a/+a populations (see Figure 5C).
Figure 7
Figure 7
Elevated FST or copy-number variation between northern and southern Cameroon populations in protein coding genes. FST is plotted for individual SNPs along the gene models (solid rectangles, exons; horizontal lines, introns). Nonsynonymous and splice site mutations are indicated by red and blue circles, respectively. Divergence in (A) the JIL-1 ortholog, AGAP006094 in the 2La rearrangement; (B) the cluster of gustatory receptors GPRGR29-32 in the 2La rearrangement; (C) AGAP002628 in the 2Rb rearrangement, a putative member of the immunoglobulin superfamily; (D) an intergenic region upstream and nearby two genes in a collinear region on 3R; (E) the Methuselah receptor 4 ortholog AGAP006218 in the 2La rearrangement. In addition to FST at individual SNPs, read coverage is shown for each population (northern, green line; southern, red line) in relation to the gene model.

Comment in

References

    1. Akey J. M., Ruhe A. L., Akey D. T., Wong A. K., Connelly C. F., et al. , 2010. Tracking footprints of artificial selection in the dog genome. Proc. Natl. Acad. Sci. USA 107: 1160–1165 - PMC - PubMed
    1. Andolfatto P., Depaulis F., Navarro A., 2001. Inversion polymorphisms and nucleotide variability in Drosophila. Genet. Res. 77: 1–8 - PubMed
    1. Ayala D., Costantini C., Ose K., Kamdem G. C., Antonio-Nkondjio C., et al. , 2009. Habitat suitability and ecological niche profile of major malaria vectors in Cameroon. Malar. J. 8: 307. - PMC - PubMed
    1. Ayala D., Fontaine M. C., Cohuet A., Fontenille D., Vitalis R., et al. , 2011. Chromosomal inversions, natural selection and adaptation in the malaria vector Anopheles funestus. Mol. Biol. Evol. 28: 745–758 - PMC - PubMed
    1. Ayala F. J., Coluzzi M., 2005. Chromosome speciation: Humans, Drosophila, and mosquitoes. Proc. Natl. Acad. Sci. USA 102(Suppl 1): 6535–6542 - PMC - PubMed

Publication types

MeSH terms