

Evaluating the PCPT risk calculator in ten international biopsy cohorts: results from the Prostate Biopsy Collaborative Group
- PMID: 22210512
- PMCID: PMC3616370
- DOI: 10.1007/s00345-011-0818-5
Evaluating the PCPT risk calculator in ten international biopsy cohorts: results from the Prostate Biopsy Collaborative Group
Abstract
Objectives: To evaluate the discrimination, calibration, and net benefit performance of the Prostate Cancer Prevention Trial Risk Calculator (PCPTRC) across five European randomized study of screening for prostate cancer (ERSPC), 1 United Kingdom, 1 Austrian, and 3 US biopsy cohorts.
Methods: PCPTRC risks were calculated for 25,733 biopsies using prostate-specific antigen (PSA), digital rectal examination, family history, history of prior biopsy, and imputation for missing covariates. Predictions were evaluated using the areas underneath the receiver operating characteristic curves (AUC), discrimination slopes, chi-square tests of goodness of fit, and net benefit decision curves.
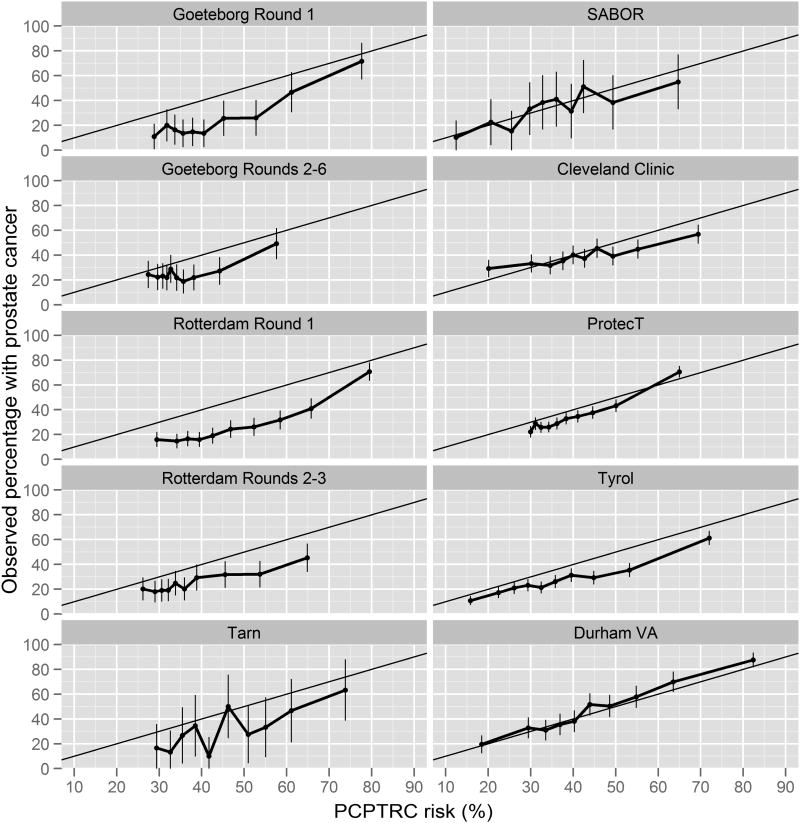
Results: AUCs of the PCPTRC ranged from a low of 56% in the ERSPC Goeteborg Rounds 2-6 cohort to a high of 72% in the ERSPC Goeteborg Round 1 cohort and were statistically significantly higher than that of PSA in 6 out of the 10 cohorts. The PCPTRC was well calibrated in the SABOR, Tyrol, and Durham cohorts. There was limited to no net benefit to using the PCPTRC for biopsy referral compared to biopsying all or no men in all five ERSPC cohorts and benefit within a limited range of risk thresholds in all other cohorts.
Conclusions: External validation of the PCPTRC across ten cohorts revealed varying degree of success highly dependent on the cohort, most likely due to different criteria for and work-up before biopsy. Future validation studies of new calculators for prostate cancer should acknowledge the potential impact of the specific cohort studied when reporting successful versus failed validation.
Conflict of interest statement
Conflict of Interest: The authors declare that they have no conflict of interest.
Figures
Similar articles
-
Importance of prostate volume in the European Randomised Study of Screening for Prostate Cancer (ERSPC) risk calculators: results from the prostate biopsy collaborative group.World J Urol. 2012 Apr;30(2):149-55. doi: 10.1007/s00345-011-0804-y. Epub 2011 Dec 28. World J Urol. 2012. PMID: 22203238 Free PMC article.
-
Evaluating the Prostate Cancer Prevention Trial High Grade Prostate Cancer Risk Calculator in 10 international biopsy cohorts: results from the Prostate Biopsy Collaborative Group.World J Urol. 2014 Feb;32(1):185-91. doi: 10.1007/s00345-012-0869-2. Epub 2012 Apr 22. World J Urol. 2014. PMID: 22527674 Free PMC article.
-
A Contemporary Prostate Biopsy Risk Calculator Based on Multiple Heterogeneous Cohorts.Eur Urol. 2018 Aug;74(2):197-203. doi: 10.1016/j.eururo.2018.05.003. Epub 2018 May 16. Eur Urol. 2018. PMID: 29778349 Free PMC article.
-
Prostate-Specific Antigen-Based Screening for Prostate Cancer: A Systematic Evidence Review for the U.S. Preventive Services Task Force [Internet].Rockville (MD): Agency for Healthcare Research and Quality (US); 2018 May. Report No.: 17-05229-EF-1. Rockville (MD): Agency for Healthcare Research and Quality (US); 2018 May. Report No.: 17-05229-EF-1. PMID: 30085502 Free Books & Documents. Review.
-
Biases in Recommendations for and Acceptance of Prostate Biopsy Significantly Affect Assessment of Prostate Cancer Risk Factors: Results From Two Large Randomized Clinical Trials.J Clin Oncol. 2016 Dec 20;34(36):4338-4344. doi: 10.1200/JCO.2016.68.1965. Epub 2016 Oct 28. J Clin Oncol. 2016. PMID: 27998216 Free PMC article. Review.
Cited by
-
Incorporation of Urinary Prostate Cancer Antigen 3 and TMPRSS2:ERG into Prostate Cancer Prevention Trial Risk Calculator.Eur Urol Focus. 2019 Jan;5(1):54-61. doi: 10.1016/j.euf.2018.01.010. Epub 2018 Feb 13. Eur Urol Focus. 2019. PMID: 29422418 Free PMC article.
-
A prostate cancer risk calculator: Use of clinical and magnetic resonance imaging data to predict biopsy outcome in North American men.Can Urol Assoc J. 2022 Mar;16(3):E161-E166. doi: 10.5489/cuaj.7380. Can Urol Assoc J. 2022. PMID: 34672937 Free PMC article.
-
Evaluation of PSA-age volume score in predicting prostate cancer in Chinese population.Asian J Androl. 2018 Jul-Aug;20(4):324-329. doi: 10.4103/aja.aja_81_17. Asian J Androl. 2018. PMID: 29405172 Free PMC article.
-
Racial Variation in the Utility of Urinary Biomarkers PCA3 and T2ERG in a Large Multicenter Study.J Urol. 2017 Jul;198(1):42-49. doi: 10.1016/j.juro.2017.01.058. Epub 2017 Jan 20. J Urol. 2017. PMID: 28115190 Free PMC article.
-
The Use of Magnetic Resonance Imaging in the Prostate Cancer Primary Diagnostic Pathway: Is It Ready for Primetime?World J Mens Health. 2018 Sep;36(3):223-229. doi: 10.5534/wjmh.2018.180025. World J Mens Health. 2018. PMID: 30168298 Free PMC article. Review.
References
-
- Thompson IM, Ankerst DP, Chi C, Goodman PJ, Tangen CM, Lucia MS, Feng Z, Parnes HL, Coltman CA., Jr Assessing prostate cancer risk: results from the Prostate Cancer Prevention Trial. J Natl Cancer Inst. 2006;98:529–534. - PubMed
-
- Vickers AJ, Cronin AM, Roobol MJ, Hugosson J, Jones JS, Kattan MW, Klein E, Hamdy F, Neal D, Donovan J, Parekh DJ, Ankerst D, Bartsch G, Klocker H, Horninger W, Benchikh A, Salama G, Villers A, Freedland SJ, Moreira DM, Schroeder FH, Lilja H. The relationship between prostate-specific antigen and prostate cancer risk: the Prostate Biopsy Collaborative Group. Clinical Cancer Research. 2010;16:4374–4381. - PMC - PubMed
-
- van Buuren S. Multiple imputation of discrete and continuous data by fully conditional specification. Statistical Methods in Medical Research. 2007;16:219–242. - PubMed
-
- Janssen KJM, Donders ART, Harrell FE, Jr, Vergouwe Y, Chen Q, Grobbee DE, Moons KGM. Missing covariate data in medical research: To impute is better than to ignore. Journal of Clinical Epidemiology. 2010;63:721–727. - PubMed
-
- DeLong ER, DeLong DM, Clarke-Pearson DL. Comparing the areas under two or more correlated receiver operating characteristic curves: a nonparametric approach. Biometrics. 1988;44:837–845. - PubMed
Publication types
MeSH terms
Substances
Grants and funding
LinkOut - more resources
Full Text Sources
Other Literature Sources
Medical
Research Materials
Miscellaneous
