Comparative Study
. 2012 Jun;11(6):M111.010801.
doi: 10.1074/mcp.M111.010801. Epub 2011 Dec 30.

On marathons and Sprints: an integrated quantitative proteomics and transcriptomics analysis of differences between slow and fast muscle fibers

Affiliations
Comparative Study

On marathons and Sprints: an integrated quantitative proteomics and transcriptomics analysis of differences between slow and fast muscle fibers

Hannes C A Drexler et al. Mol Cell Proteomics. 2012 Jun.

Abstract

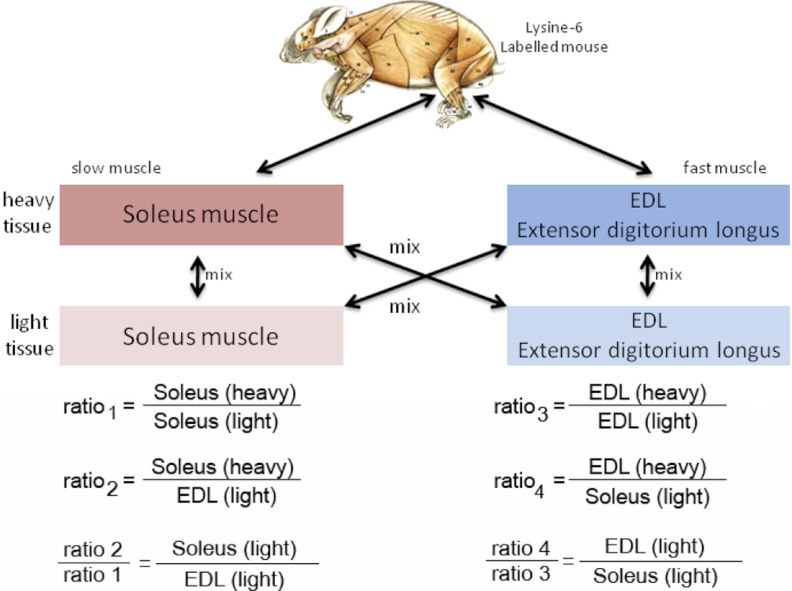
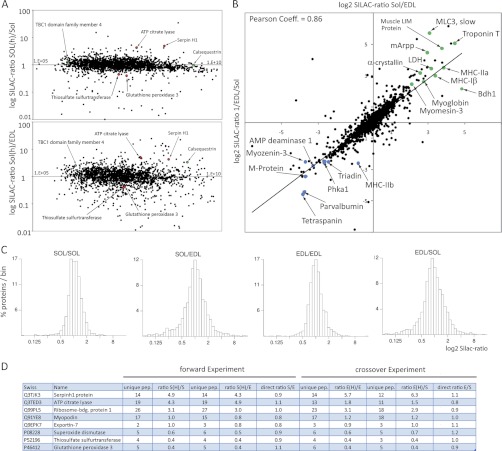
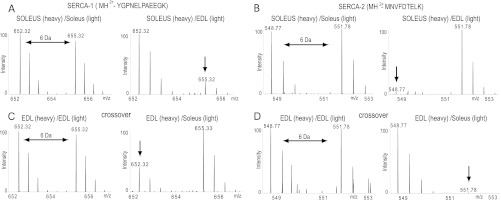
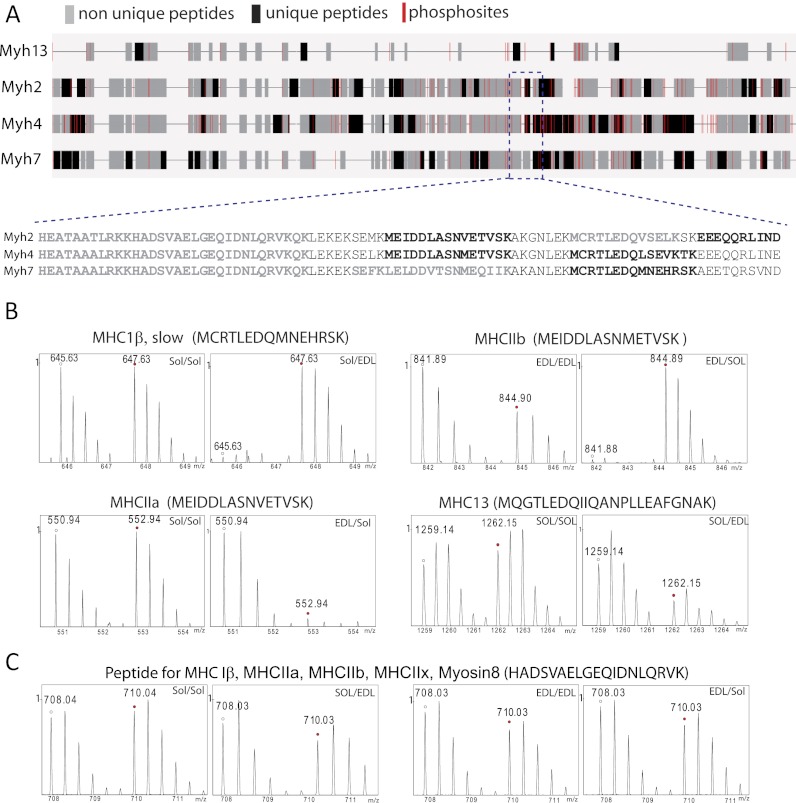
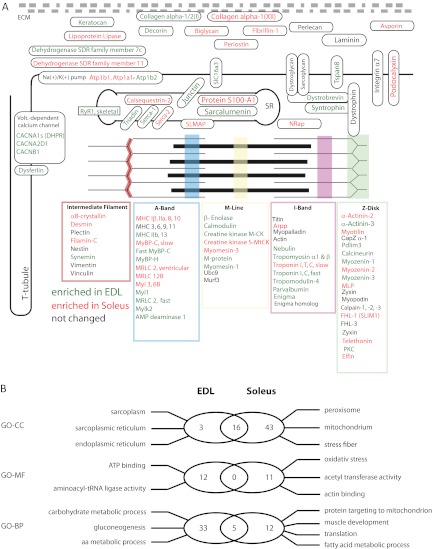
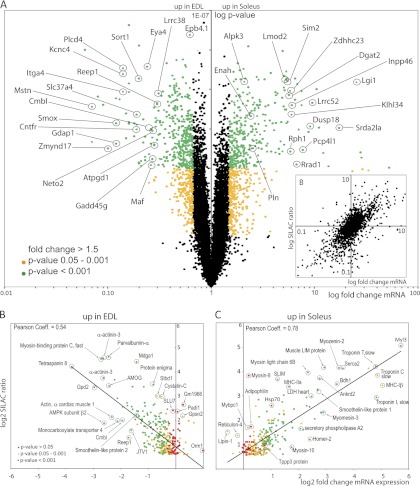
Skeletal muscle tissue contains slow as well as fast twitch muscle fibers that possess different metabolic and contractile properties. Although the distribution of individual proteins in fast and slow fibers has been investigated extensively, a comprehensive proteomic analysis, which is key for any systems biology approach to muscle tissues, is missing. Here, we compared the global protein levels and gene expression profiles of the predominantly slow soleus and fast extensor digitorum longus muscles using the principle of in vivo stable isotope labeling with amino acids based on a fully lysine-6 labeled SILAC-mouse. We identified 551 proteins with significant quantitative differences between slow soleus and fast extensor digitorum longus fibers out of >2000 quantified proteins, which greatly extends the repertoire of proteins differentially regulated between both muscle types. Most of the differentially regulated proteins mediate cellular contraction, ion homeostasis, glycolysis, and oxidation, which reflect the major functional differences between both muscle types. Comparison of proteomics and transcriptomics data uncovered the existence of fiber-type specific posttranscriptional regulatory mechanisms resulting in differential accumulation of Myosin-8 and α-protein kinase 3 proteins and mRNAs among others. Phosphoproteome analysis of soleus and extensor digitorum longus muscles identified 2573 phosphosites on 973 proteins including 1040 novel phosphosites. The in vivo stable isotope labeling with amino acids-mouse approach used in our study provides a comprehensive view into the protein networks that direct fiber-type specific functions and allows a detailed dissection of the molecular composition of slow and fast muscle tissues with unprecedented resolution.


Figures

Fig. 1.
Fig. 1.
Design of forward and reverse in vivo SILAC experiments. For relative quantification of proteins in slow versus fast twitch muscle fibers fully lysine-6 labeled tissues (heavy) were used as internal standard. Ratios between unlabeled slow and unlabeled fast muscle fibers were calculated as indicated.
Fig. 2.
Fig. 2.
Comparison of slow and fast muscle proteins. A, Distribution of ratios for peptides identified from labeled versus non-labeled extracts. The log ratio of all peptides were plotted against the sum of heavy and light peak intensities for both the comparison of the same fiber type (Sol/Sol; upper panel) and different fiber types (Sol/EDL; lower panel). Note that some proteins (red) do not show any significant changes during fiber comparison, whereas other proteins e.g. calsequestrin (green) are differentially regulated. B, Histogram representation of the binned log ratios of all quantified proteins. Distributions center more closely around a ratio of 1 in comparisons of light and heavy muscle fibers of the same type while they are more dispersed in comparisons of different fiber types. C, Correlation plot between forward (Sol/EDL) and reverse experiment (EDL/Sol), representative examples of proteins overrepresented in soleus fibers are marked in green, examples of proteins overrepresented in EDL muscle are marked in blue. D, Employing SILAC-labeled control mice as internal standard simplifies the identification of different protein abundances in both fiber types by determining the direct ratios between unlabeled soleus and unlabeled EDL muscle. A ratio of 1 indicates equal distribution.
Fig. 3.
Fig. 3.
MS spectra of heavy and light peptide pairs derived from SERCA1 and SERCA2. The SERCA1 peptide MH2+-YGPNELPAEEGK is less abundant in soleus muscle fibers (A; arrow), whereas the SERCA2 derived peptide MH2+-MNVFDTELK is overrepresented in EDL fibers (B; arrow). The inverse patterns are seen in the corresponding crossover experiments (C, D).
Fig. 4.
Fig. 4.
Schematic alignment of myosin heavy chains. A, Mapping of quantifiable myosin heavy chain (MyHC) peptides to their corresponding gene locus. Unique peptides used for quantification are indicated in black, non-unique peptides (not used for quantification) are marked in gray. Localization of phoshorylation sites are shown in red. B, MS spectra of representative SILAC peptide pairs derived from MyHC-1β, -IIa, -IIb, or MyHC-13 that show over- or underrepresentation in either soleus or EDL muscle. C, Example of a quantifiable peptide that is shared by various members of the MyHC1β family and that was therefore excluded from quantification.
Fig. 5.
Fig. 5.
Schematic representation of skeletal muscle fiber structure and composition. A, Selected muscle proteins identified and quantified in our screen are depicted according to their subcellular localization (green = overrepresented in EDL; red = overrepresented in Soleus, black = no quantitative difference between EDL and Soleus). B, Venn diagram summarizing the results of a gene ontology analysis of proteins differentially expressed in EDL and soleus. Significantly overrepresented GO terms are provided for EDL (left) and soleus (right).
Fig. 6.
Fig. 6.
Correlation between proteomic and genomic data sets. A, Hybridization of cDNAs isolated from both muscle fiber types revealed enrichment for 1442 (p < 0.05) transcripts in either the EDL or the Soleus muscle. All transcripts with a fold change > 1.5 (p value <0.001) are indicated in green. Transcripts with fold change >1.5 and p values of 0.001–0.05 are indicated as yellow dots. Transcripts with fold changes <1.5 are shown in black. B, SILAC ratios of all quantified proteins plotted versus the fold change of mRNA abundance of the corresponding proteins. Pearson correlation coefficient = 0.81. C, D, Correlation of protein abundances (SILAC ratios) with mRNA expression levels (fold change mRNA expression) for proteins up-regulated either in EDL fibers (C) or soleus fibers (D). Selected proteins are encircled.

Similar articles

Cited by

References

    1. Schiaffino S., Reggiani C. (1996) Molecular diversity of myofibrillar proteins: gene regulation and functional significance. Physiol. Rev. 76, 371–423 - PubMed
    1. Booth F. W., Thomason D. B. (1991) Molecular and cellular adaptation of muscle in response to exercise: perspectives of various models. Physiol. Rev. 71, 541–585 - PubMed
    1. Pette D., Staron R. S. (2000) Myosin isoforms, muscle fiber types, and transitions. Microsc. Res. Tech. 50, 500–509 - PubMed
    1. Dhoot G. K., Perry S. V. (1979) Distribution of polymorphic forms of troponin components and tropomyosin in skeletal muscle. Nature 278, 714–718 - PubMed
    1. MacLennan D. H., Toyofuku T., Lytton J. (1992) Structure-function relationships in sarcoplasmic or endoplasmic reticulum type Ca2+ pumps. Ann. N.Y. Acad. Sci. 671, 1–10 - PubMed

Publication types

MeSH terms

LinkOut - more resources