Right ventricular regional wall curvedness and area strain in patients with repaired tetralogy of Fallot
- PMID: 22210750
- PMCID: PMC3311479
- DOI: 10.1152/ajpheart.00679.2011
Right ventricular regional wall curvedness and area strain in patients with repaired tetralogy of Fallot
Abstract
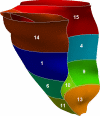
A quantitative understanding of right ventricular (RV) remodeling in repaired tetralogy of Fallot (rTOF) is crucial for patient management. The objective of this study is to quantify the regional curvatures and area strain based on three-dimensional (3-D) reconstructions of the RV using cardiac magnetic resonance imaging (MRI). Fourteen (14) rTOF patients and nine (9) normal subjects underwent cardiac MRI scan. 3-D RV endocardial surface models were reconstructed from manually delineated contours and correspondence between end-diastole (ED) and end systole (ES) was determined. Regional curvedness (C) and surface area at ED and ES were calculated as well as the area strain. The RV shape and deformation in rTOF patients differed from normal subjects in several respects. Firstly, the curvedness at ED (mean for 13 segments, 0.030 ± 0.0076 vs. 0.029 ± 0.0065 mm(-1); P < 0.05) and ES (mean for 13 segments, 0.040 ± 0.012 vs. 0.034 ± 0.0072 mm(-1); P < 0.001) was decreased by chronic pulmonary regurgitation. Secondly, the surface area increased significantly at ED (mean for 13 segments, 982 ± 192 vs. 1,397 ± 387 mm(2); P < 0.001) and ES (mean for 13 segments, 576 ± 130 vs. 1,012 ± 302 mm(2); P < 0.001). In particular, rTOF patients had significantly larger surface area than that in normal subjects in the free wall but not for the septal wall. Thirdly, area strain was significantly decreased (mean for 13 segments, 56 ± 6 vs. 34 ± 7%; P < 0.0001) in rTOF patients. Fourthly, there were increases in surface area at ED (5,726 ± 969 vs. 6,605 ± 1,122 mm(2); P < 0.05) and ES (4,280 ± 758 vs. 5,569 ± 1,112 mm(2); P < 0.01) and decrease in area strain (29 ± 8 vs. 18 ± 8%; P < 0.001) for RV outflow tract. These findings suggest significant geometric and strain differences between rTOF and normal subjects that may help guide therapeutic treatment.
Figures




Similar articles
-
Three-dimensional analysis of regional right ventricular shape and function in repaired tetralogy of Fallot using cardiovascular magnetic resonance.Clin Imaging. 2018 Nov-Dec;52:106-112. doi: 10.1016/j.clinimag.2018.07.007. Epub 2018 Jul 7. Clin Imaging. 2018. PMID: 30041117 Free PMC article.
-
Left and right ventricular dyssynchrony and strains from cardiovascular magnetic resonance feature tracking do not predict deterioration of ventricular function in patients with repaired tetralogy of Fallot.J Cardiovasc Magn Reson. 2016 Aug 22;18(1):49. doi: 10.1186/s12968-016-0268-8. J Cardiovasc Magn Reson. 2016. PMID: 27549809 Free PMC article.
-
Impact of surgical pulmonary valve replacement on ventricular mechanics in children with repaired tetralogy of Fallot.Int J Cardiovasc Imaging. 2017 May;33(5):711-720. doi: 10.1007/s10554-016-1046-2. Epub 2016 Dec 22. Int J Cardiovasc Imaging. 2017. PMID: 28005218
-
Characteristics of left ventricular dysfunction in repaired tetralogy of Fallot: A multi-institutional deep learning analysis of regional strain and dyssynchrony.J Cardiovasc Magn Reson. 2025 Summer;27(1):101886. doi: 10.1016/j.jocmr.2025.101886. Epub 2025 Mar 21. J Cardiovasc Magn Reson. 2025. PMID: 40122390 Free PMC article.
-
Comparison of stroke work between repaired tetralogy of Fallot and normal right ventricular physiologies.Heart Vessels. 2013 Jan;28(1):76-85. doi: 10.1007/s00380-011-0212-7. Epub 2011 Dec 28. Heart Vessels. 2013. PMID: 22203408
Cited by
-
Regional Differences in End-Diastolic Volumes between 3D Echo and CMR in HLHS Patients.Front Pediatr. 2016 Dec 12;4:133. doi: 10.3389/fped.2016.00133. eCollection 2016. Front Pediatr. 2016. PMID: 28018895 Free PMC article.
-
Application of Patient-Specific Computational Fluid Dynamics in Coronary and Intra-Cardiac Flow Simulations: Challenges and Opportunities.Front Physiol. 2018 Jun 26;9:742. doi: 10.3389/fphys.2018.00742. eCollection 2018. Front Physiol. 2018. PMID: 29997520 Free PMC article. Review.
-
Regional shape, global function and mechanics in right ventricular volume and pressure overload conditions: a three-dimensional echocardiography study.Int J Cardiovasc Imaging. 2021 Apr;37(4):1289-1299. doi: 10.1007/s10554-020-02117-8. Epub 2021 Jan 3. Int J Cardiovasc Imaging. 2021. PMID: 33389362 Free PMC article.
-
Fresh Autologous Pericardium to Reconstruct the Pulmonary Valve at the Annulus When Tetralogy of Fallot Requires a Transannular Patch at Midterm.Tex Heart Inst J. 2016 Jun 1;43(3):207-13. doi: 10.14503/THIJ-14-4609. eCollection 2016 Jun. Tex Heart Inst J. 2016. PMID: 27303235 Free PMC article.
-
Derivation and Validation of a Nomogram to Predict In-Hospital Complications in Children with Tetralogy of Fallot Repaired at an Older Age.J Am Heart Assoc. 2019 Nov 5;8(21):e013388. doi: 10.1161/JAHA.119.013388. Epub 2019 Oct 24. J Am Heart Assoc. 2019. PMID: 31645167 Free PMC article.
References
-
- Anderson RH, Becker AE. The Morphologically Right Ventricle Cardiac anatomy. London: Gower Medical, 1980, p. 3.12–3.24
-
- Babu-Narayan SV, Kilner PJ, Li W, Moon JC, Goktekin Davlouros PA O, Khan M, Ho SY, Pennell DJ, Gatzoulis MA. Ventricular fibrosis suggested by cardiovascular magnetic resonance in adults with repaired tetralogy of Fallot and its relationship to adverse markers of clinical outcome. Circulation 113: 405–413, 2006 - PubMed
-
- Bacha EA, Scheule AM, Zurakowski D, Erickson LC, Hung J, Lang P, Mayer JE, Jr, del Nido PJ, Jonas RA. Long-term results after early primary repair of tetralogy of Fallot. J Thorac Cardiovasc Surg 122: 154–161, 2001 - PubMed
-
- Bellenger NG, Francis JM, Davies CL, Coats A, Pennell DJ. Establishment and performance of a magnetic resonance cardiac function clinic. J Cardiovasc Magn Reson 2: 15–22, 2000 - PubMed
-
- Bowyer A. Computing Dirichlet tessellations. Comput J 24: 162–166, 1981
Publication types
MeSH terms
Grants and funding
LinkOut - more resources
Full Text Sources
Other Literature Sources
Medical

