. 2012 Apr;40(8):3364-77.
doi: 10.1093/nar/gkr1253. Epub 2011 Dec 30.

Acute depletion of Tet1-dependent 5-hydroxymethylcytosine levels impairs LIF/Stat3 signaling and results in loss of embryonic stem cell identity

Affiliations

Acute depletion of Tet1-dependent 5-hydroxymethylcytosine levels impairs LIF/Stat3 signaling and results in loss of embryonic stem cell identity

Johannes M Freudenberg et al. Nucleic Acids Res. 2012 Apr.

Abstract

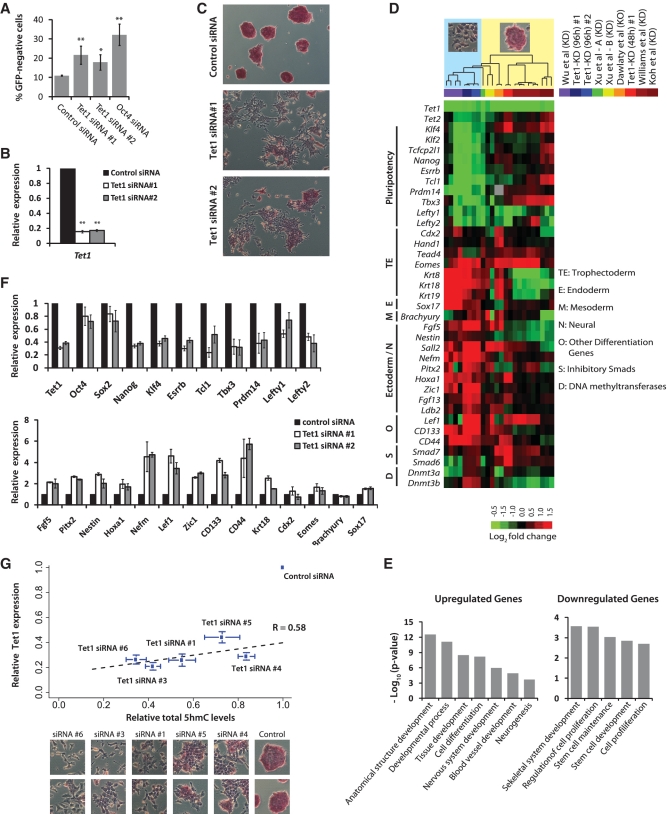
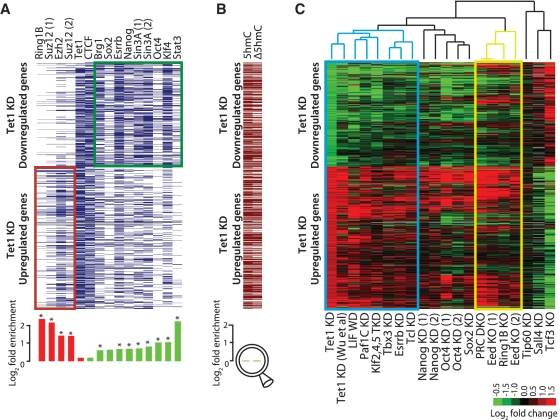
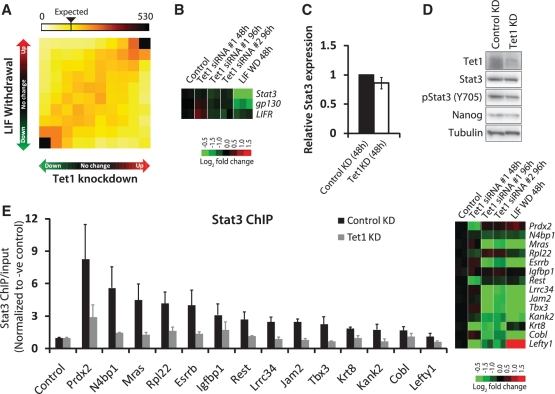
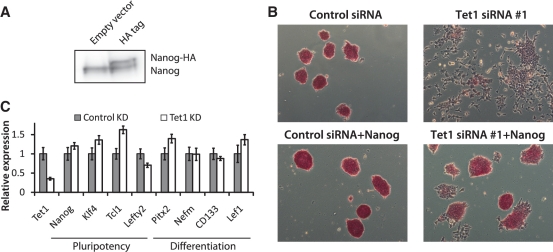
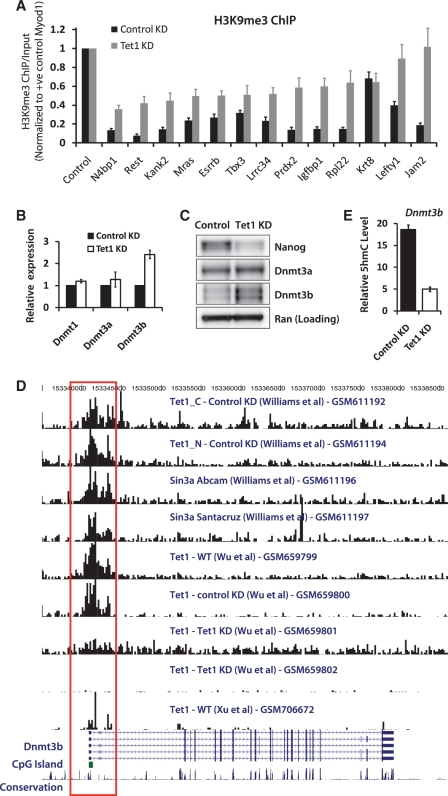
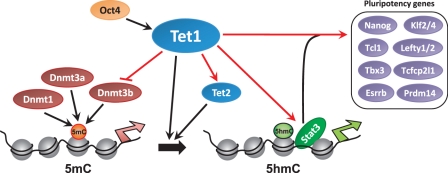
The TET family of FE(II) and 2-oxoglutarate-dependent enzymes (Tet1/2/3) promote DNA demethylation by converting 5-methylcytosine to 5-hydroxymethylcytosine (5hmC), which they further oxidize into 5-formylcytosine and 5-carboxylcytosine. Tet1 is robustly expressed in mouse embryonic stem cells (mESCs) and has been implicated in mESC maintenance. Here we demonstrate that, unlike genetic deletion, RNAi-mediated depletion of Tet1 in mESCs led to a significant reduction in 5hmC and loss of mESC identity. The differentiation phenotype due to Tet1 depletion positively correlated with the extent of 5hmC loss. Meta-analyses of genomic data sets suggested interaction between Tet1 and leukemia inhibitory factor (LIF) signaling. LIF signaling is known to promote self-renewal and pluripotency in mESCs partly by opposing MAPK/ERK-mediated differentiation. Withdrawal of LIF leads to differentiation of mESCs. We discovered that Tet1 depletion impaired LIF-dependent Stat3-mediated gene activation by affecting Stat3's ability to bind to its target sites on chromatin. Nanog overexpression or inhibition of MAPK/ERK signaling, both known to maintain mESCs in the absence of LIF, rescued Tet1 depletion, further supporting the dependence of LIF/Stat3 signaling on Tet1. These data support the conclusion that analysis of mESCs in the hours/days immediately following efficient Tet1 depletion reveals Tet1's normal physiological role in maintaining the pluripotent state that may be subject to homeostatic compensation in genetic models.


Figures

Figure 1.
Figure 1.
Depletion of Tet1 and 5hmC levels results in loss of mouse embryonic stem identity. (A) Oct4GiP mESCs were transfected with indicated siRNAs in normal ESC medium and cultured for 96 h. The percentage of differentiated cells was determined by measuring the percentage of GFP-negative cells using FACS at 96 h after transfection (**P < 0.001; *P < 0.01). Error bars represent SEM of three experiments. (B) Relative Tet1 mRNA level in control and Tet1 KD Oct4GiP mESCs 48 h after transfection. Data are normalized to Actin. Error bars represent SEM of three experiments (**P < 0.001). Error bars represent SEM of three experiments. (C) AP staining of Oct4GiP mESCs transfected with control siRNA, and Tet1 siRNAs #1 and #2. Cells were cultured in normal ESC medium, and AP staining was performed 96 h after transfection. See Supplementary Figure S1B for AP staining results for siRNA #1 and four additional siRNAs on Oct4GiP, J1 and E14tg2a mESCs. (D) Expression fold changes of selected genes upon Tet1 KD in mESCs based on microarray analysis performed 48 and 96 h after transfection. Fold changes from data generated for this study [Tet1-KD (96 h) #1, #2 and Tet1-KD (48 h) #1] are presented alongside fold changes observed in recently published Tet1 KD (≥96 h) or knockout studies (color-coded on the top-right). Each column corresponds to fold changes obtained from an individual array computed in relation to its corresponding control array. Observed/reported morphological changes are symbolically indicated at the top, with columns ordered based on unsupervised hierarchical clustering. See Supplementary Figure S1C for a comprehensive heatmap. (E) Gene ontology analyses of up- and down-regulated genes in Tet1 KD cells compared to control cells. Only selected categories are shown. For complete lists, see Supplementary Table S6. (F) Relative mRNA levels of selected mESC pluripotency-associated genes and lineage marker genes in control and Tet1 KD mESCs at 96 h after transfection. The mRNA levels in control cells are set as one. Data are normalized to Actin. Error bars represent SEM of three experiments. (G) Scatter plot showing strong positive correlation among relative Tet1 mRNA levels, relative total 5hmC levels, morphogical changes, and AP staining in control and Tet1 KD E14Tg2a mESCs. Each data point corresponds to a siRNA that was used for transfection. The y-axis indicates relative Tet1 mRNA levels 96 h after KD, and the x-axis represents quantified intensity of 5hmC signal inferred from slot blot (96 h). Bottom panel show the corresponding representative morphological changes and AP staining for each siRNA. Error bars represent SEM of data from five replicates (different amounts of DNA were spotted) from two independent experiments.
Figure 2.
Figure 2.
Meta-analysis of genomic data sets suggests interaction between Tet1 and LIF/Stat3 signaling. (A) Top: Transcription factor occupancy at 919 genes differentially expressed upon Tet1 KD (389 downregulated and 530 upregulated). Genes are represented along the y-axis and factor occupancy is denoted by blue bar. Target gene occupancy is defined as factor occupancy within 5-Kb upstream of the gene's TSS and/or within its gene body. Bottom: Log-fold enrichment of factor occupancy at up/downregulated genes. Red and green histograms denote enrichment in up- and down-regulated genes, respectively. *P < 0.01 after Bonferroni adjustment for multiple testing. (B) Top: Presence/absence of 5hmC sites (5hmC) in control mESCs, and 5hmC sites with ≥1.5-fold reduced hydroxymethylation levels (Δ5hmC) in Tet1 KD mESCs (96 h). Bottom: Log-fold enrichment at down- versus up-regulated genes, respectively. (C) Expression fold changes of 919 genes differentially expressed upon Tet1 KD (96 h; first column) presented alongside fold changes observed after KD or knockout (KO) of select other pluripotency factors in published reports. Genes are represented along the y-axis. Data sets along the x-axis have been ordered based on unsupervised hierarchical clustering of corresponding gene expression fold changes. Blue and yellow rectangles highlight Tet1-LIF and Polycomb clusters, respectively. Cells with no/missing data are colored in gray (DKO: double KO).
Figure 3.
Figure 3.
Dependence of LIF/Stat3 signaling on Tet1. (A) Two-dimensional gene density heatmap depicting global gene expression changes 96 h after Tet1 KD against changes observed 48 h after LIF withdrawal (51). The intensity of each square represents the number of genes that fall within that square. Axes indicate degree of fold change, from nil (middle of axis) to >1.5-fold (outermost squares). (B) Gene expression fold changes observed in microarray analysis 48 and 96 h after Tet1 KD in mESCs, and 48 h after LIF withdrawal (51). (C) Relative Stat3 mRNA level in control and Tet1 KD mESCs. The mRNA level in control KD cells is set as one. Data are normalized to Actin. Error bars represent SEM of three experiments. (D) Western blot analysis showing protein levels in control and Tet1 KD (48 h) mESCs. Tubulin is used as a loading control. (E) Left: ChIP assay of select Stat3 target regions using an antibody against Stat3 in control KD and Tet1 KD mESCs (48 h). The y-axis represents enrichment over input normalized to a negative control region (Yipf2). Refer to Supplementary Figure S4 for data from control ChIP using a non-specific antibody against IgG. Error bars represent SEM of three experiments. Right: Gene expression fold changes observed in microarray analysis 48 and 96 h after Tet1 KD in mESCs, and 48 h after LIF withdrawal (51).
Figure 4.
Figure 4.
Nanog overexpression or suppression of MAPK/ERK signaling rescues Tet1 KD phenotype. (A) Western blot analysis showing Nanog overexpression with HA-tag. (B) AP staining of E14Tg2a mESCs, with and without Nanog overexpression, transfected with control siRNA and Tet1 siRNA #1. Cells were cultured in normal ESC medium, and AP staining was performed 96 h after transfection. (C) Relative mRNA levels of selected mESC pluripotency genes and differentiation marker genes in control and Tet1 KD mESCs in 2i medium. Oct4GiP cells were transfected with control siRNA or Tet1 siRNA #1 at 50 nM in 24-well plates in 2i-medium (which inhibits MAPK/ERK and Gsk-3b signaling) and cells were harvested 96 h after transfection. The mRNA levels in control cells are set as one. Data are normalized to Actin. Error bars represent SEM of three experiments.
Figure 5.
Figure 5.
Tet1 negatively regulates de novo DNA methyltransferase Dnmt3b. (A) ChIP assay of select Stat3 target regions using an antibody against H3K9me3 in control and Tet1 KD mESCs (48 h). The y-axis represents enrichment over input normalized to a positive control region (Myod1) for H3K9me3. Error bars represent SEM of three experiments. (B) Relative mRNA levels of DNA methyltransferases Dnmt1, Dnmt3a and Dnmt3b in control and Tet1 KD mESCs 96 h after transfection. The mRNA levels in control cells are set as 1. Data are normalized to Actin. Error bars represent SEM of three experiments. (C) Western blot analysis showing protein levels of Nanog, Dnmt3a and Dnmt3b in control and Tet1 KD mESCs 96 h after transfection. Ran is used as a loading control. (D) Genome browser shot showing a region containing the Dnmt3b gene and results from Tet1 and Sin3a ChIP-Seq experiments by various groups (GSM numbers denote GEO accession). The red open rectangle highlights Tet1 occupancy at the promoter region of Dnmt3b, where a CpG island is present (green-filled rectangle). (E) Relative 5hmC levels at Dnmt3b locus in control and Tet1 KD (96 h) mESCs. Error bars represent SEM of three experiments.
Figure 6.
Figure 6.
Proposed model for Tet1-mediated epigenetic and transcriptional regulation of mESC self-renewal and pluripotency. Red arrows denote regulatory interactions inferred from data generated for this study. Tet1, regulated by Oct4 (28), regulates DNA methylation (5mC) by converting 5mC to 5hmC (16,28). Tet1 regulates LIF/Stat3 signaling by facilitating Stat3 binding by an yet to be determined mechanism, and regulates the transcriptional regulatory module comprising Nanog, Esrrb, Tcl1, Tbx3, Klf2/4, Prdm14 and Lefty1/2. Tet1's regulation of Tet2 confers tight regulation of 5mC to 5hmC conversion. Tet1's negative regulation of de novo DNA methyltransferase Dnmt3b may provide an additional layer of Tet1-mediated regulation of 5mC. Silent and active promoters on the chromatin are denoted by broad red and green arrows, respectively.

Similar articles

Cited by

References

    1. Jaenisch R, Young R. Stem cells, the molecular circuitry of pluripotency and nuclear reprogramming. Cell. 2008;132:567–582. - PMC - PubMed
    1. Macarthur BD, Ma'ayan A, Lemischka IR. Systems biology of stem cell fate and cellular reprogramming. Nat. Rev. Mol. Cell Biol. 2009;10:672–681. - PMC - PubMed
    1. Nichols J, Smith A. Naive and primed pluripotent states. Cell Stem Cell. 2009;4:487–492. - PubMed
    1. Lessard JA, Crabtree GR. Chromatin regulatory mechanisms in pluripotency. Annu. Rev. Cell Dev. Biol. 2010;26:503–532. - PMC - PubMed
    1. Loh YH, Yang L, Yang JC, Li H, Collins JJ, Daley GQ. Genomic approaches to deconstruct pluripotency. Annu. Rev. Genomics Hum. Genet. 2011;12:165–185. - PMC - PubMed

Publication types

MeSH terms