. 2012 Mar;40(6):e43.
doi: 10.1093/nar/gkr1227. Epub 2011 Dec 30.

An integer linear programming approach for finding deregulated subgraphs in regulatory networks

Affiliations

An integer linear programming approach for finding deregulated subgraphs in regulatory networks

Christina Backes et al. Nucleic Acids Res. 2012 Mar.

Abstract

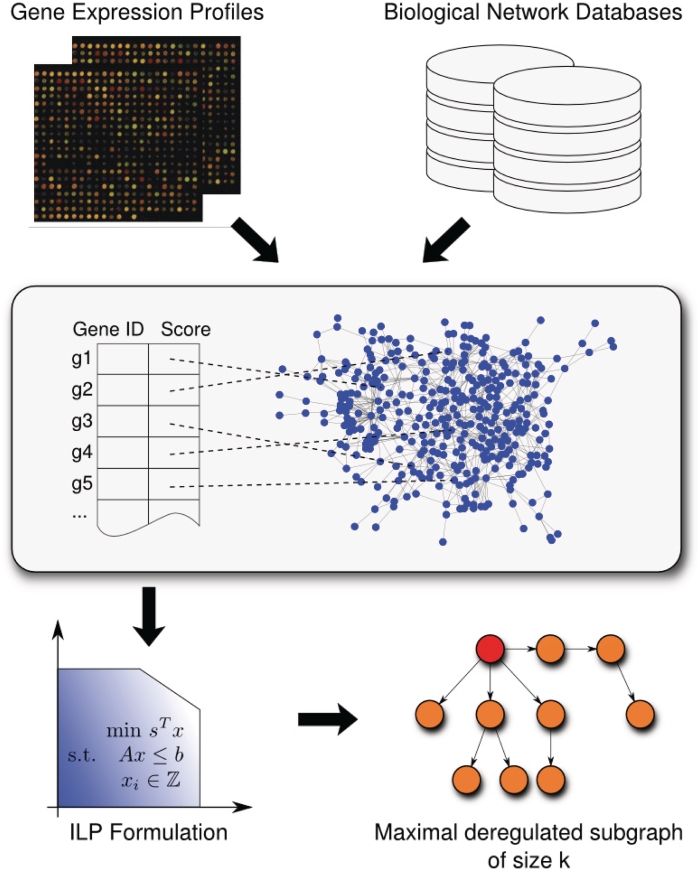
Deregulation of cell signaling pathways plays a crucial role in the development of tumors. The identification of such pathways requires effective analysis tools that facilitate the interpretation of expression differences. Here, we present a novel and highly efficient method for identifying deregulated subnetworks in a regulatory network. Given a score for each node that measures the degree of deregulation of the corresponding gene or protein, the algorithm computes the heaviest connected subnetwork of a specified size reachable from a designated root node. This root node can be interpreted as a molecular key player responsible for the observed deregulation. To demonstrate the potential of our approach, we analyzed three gene expression data sets. In one scenario, we compared expression profiles of non-malignant primary mammary epithelial cells derived from BRCA1 mutation carriers and of epithelial cells without BRCA1 mutation. Our results suggest that oxidative stress plays an important role in epithelial cells of BRCA1 mutation carriers and that the activation of stress proteins may result in avoidance of apoptosis leading to an increased overall survival of cells with genetic alterations. In summary, our approach opens new avenues for the elucidation of pathogenic mechanisms and for the detection of molecular key players.


Figures

Figure 1.
Figure 1.
Workflow of our algorithm for the computation of deregulated subgraphs. As input, it requires a biological network and a list of genes with scores that have been derived from expression data and mirror the degree of deregulation. After the scores of the genes have been mapped to the corresponding nodes of the network, our ILP-based B&C approach calculates the most deregulated subgraph that can be visualized using BiNA (23).
Figure 2.
Figure 2.
B&C workflow for solving the ILP. The ILP problem with only basic constraints is added to the instance pool (pool for considered ILP subproblems). After choosing one subproblem, the integrality contraints are dropped in order to solve the problem efficiently. In the case of identified violated constraints, they are added to the problem. If not, it has to be decided whether the solution is integer. If this is not the case, the current problem is subdivided into two or more subproblems depending on the branching strategy.
Figure 3.
Figure 3.
The most deregulated subgraph for BRCA1 mutation carriers against non-mutation carriers for a network size of 25 (red edges) with root node EGLN3 (P < 0.001). The nodes connected by gray edges are part of the union network of the deregulated subgraphs of size 10–25. The nodes are colored by the computed scores (fold differences), where shades of green correspond to downregulated and shades of red correspond to upregulated genes. The more intense the color, the higher the level of deregulation.
Figure 4.
Figure 4.
The subgraph of size k = 25 for the glioma dataset. The nodes connected by gray edges are part of the union network of the deregulated subgraphs of size 10–25. The nodes are colored by the computed scores (t-test test statistic values), where shades of green correspond to downregulated and shades of red correspond to upregulated genes. The more intense the color, the higher the level of deregulation.

Similar articles

Cited by

References

    1. Mootha V, Lindgren C, Eriksson K, Subramanian A, Sihag S, Lehar J, Puigserver P, Carlsson E, Ridderstrale M, Laurila E, et al. PGC-1alpha-responsive genes involved in oxidative phosphorylation are coordinately downregulated in human diabetes. Nat. Genet. 2003;34:267–273. - PubMed
    1. Dinu I, Potter JD, Mueller T, Liu Q, Adewale AJ, Jhangri GS, Einecke G, Famulski KS, Halloran P, Yasui Y. Improving gene set analysis of microarray data by SAM-GS. BMC Bioinformatics. 2007;8:242. - PMC - PubMed
    1. Al-Shahrour F, Arbiza L, Dopazo H, Huerta-Cepas J, Mnguez P, Montaner D, Dopazo J. From genes to functional classes in the study of biological systems. BMC Bioinformatics. 2007;8:114. - PMC - PubMed
    1. Raychaudhuri S, Plenge RM, Rossin EJ, Ng ACY, Purcell SM, Sklar P, Scolnick EM, Xavier RJ, Altshuler D, Daly MJ. Identifying relationships among genomic disease regions: predicting genes at pathogenic SNP associations and rare deletions. PLoS Genet. 2009;5:e1000534. - PMC - PubMed
    1. Ideker T, Ozier O, Schwikowski B, Siegel AF. Discovering regulatory and signalling circuits in molecular interaction networks. Bioinformatics. 2002;18(Suppl. 1):S233–S240. - PubMed

Publication types

MeSH terms