. 2012 Apr;40(8):3403-18.
doi: 10.1093/nar/gkr1290. Epub 2011 Dec 30.

Yin Yang 1 extends the Myc-related transcription factors network in embryonic stem cells

Affiliations

Yin Yang 1 extends the Myc-related transcription factors network in embryonic stem cells

Pietro Vella et al. Nucleic Acids Res. 2012 Apr.

Abstract

The Yin Yang 1 (YY1) transcription factor is a master regulator of development, essential for early embryogenesis and adult tissues formation. YY1 is the mammalian orthologue of Pleiohomeotic, one of the transcription factors that binds Polycomb DNA response elements in Drosophila melanogaster and mediates Polycomb group proteins (PcG) recruitment to DNA. Despite several publications pointing at YY1 having a similar role in mammalians, others showed features of YY1 that are not compatible with PcG functions. Here, we show that, in mouse Embryonic Stem (ES) cells, YY1 has genome-wide PcG-independent activities while it is still stably associated with the INO80 chromatin-remodeling complex, as well as with novel RNA helicase activities. YY1 binds chromatin in close proximity of the transcription start site of highly expressed genes. Loss of YY1 functions preferentially led to a down-regulation of target genes expression, as well as to an up-regulation of several small non-coding RNAs, suggesting a role for YY1 in regulating small RNA biogenesis. Finally, we found that YY1 is a novel player of Myc-related transcription factors and that its coordinated binding at promoters potentiates gene expression, proposing YY1 as an active component of the Myc transcription network that links ES to cancer cells.


Figures

Figure 1.
Figure 1.
Genome-wide localization of YY1 does not correlate with PcG proteins (A) ChIP analysis using qPCR on the indicated genomic loci using the specified antibodies. (B) Western blot analyses using the indicated antibodies of streptavidin pull-down assays from protein extracts of ES cell lines independently expressing bioEzh2 and bioYY1. A control ES cell line with BirA expression alone is presented as purification control. Dotted line denotes removal of non-relevant lanes from the original blot. (C) BioChIP analysis by qPCR on chromatin prepared from the same cell lines presented in (B). (D) Genomic snapshots of the bioChIPseq results for YY1 and control (FBio-Crtl) BirA expressing ES cells. (E) Overlap of binding sites between bioYY1 and the indicated ChIPseq datasets. (F and G) Overlap between target genes of the indicated ChIPseq datasets. Target genes are defined by the presence of at least one peak within ±2 kb from RefSeq genes annotated TSS. P-values of the indicated overlaps are determined by hypergeometric distribution.
Figure 2.
Figure 2.
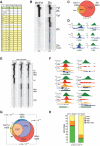
YY1 complex directly regulates active gene expression. (A) Distribution of bioYY1 binding sites relative to the gene bodies of RefSeq annotated transcripts. (B) Density profile of bioYY1 binding sites relative to TSS. All binding sites within ±10 kb are included in the analysis. TSS distance is measured as the relative base pair distance to peaks’ summits. A close up image of a ±500 bp TSS density profile is also presented with an identical band with (10 bp). (C) Annotation of gene expression levels between bioYY1 target and non-target genes. P-values are determined by Wilcoxon test. (D) MEME motif prediction of DNA sequences enriched in bioYY1 ChIPseq. YY1 Transfac matrix is presented for comparison. (E) Silver staining of the isolated proteins with a Flag-Streptavidin tandem purification using protein extracts of FBio-YY1 expressing ES cells (left). A purification using BirA expressing ES cells is presented as negative control. A summary table of the mass spectrometry results is presented on the right. Protein Abundance Index (PAI) is indicated as measure of purification efficiency. (F) Western blot analyses of streptavidin-purified proteins from nuclear extracts of the indicated ES cell lines using the specified antibodies. Input lanes correspond to 2% of extract used in IPs (G) ChIP analysis of E14 ES cells using the indicated antibodies on the specified genes TSS. (H) Western blot analysis of ES cell extracts independently transfected with YY1-specific or scrambled (SCR) control siRNA oligos. Vinculin is presented as loading control. (I) Distribution of bioYY1 binding at the promoters of differentially expressed genes in YY1 siRNA-treated ES cells. P-values are determined with a chi-square test. Stacked columns show the relative distribution of up-regulated (Up) or down-regulated (Down) bioYY1 target genes.
Figure 3.
Figure 3.
YY1 negatively regulates sncRNAs intra-cellular levels. (A) Distribution of the differentially expressed coding RNAs (cRNA) and small non-coding RNAs (sncRNA) present on the Mouse Gene 1.0 ST Affymetrix Array (center column). Differential distributions of up-regulated (Up) or down-regulated (Down) RNA classes are presented in the left and right columns. P-value is determined by chi-square test. (B) Heat map of the fold change expression values of the indicated sncRNAs and their annotated transcripts in YY1 RNAi-treated ES cells. Linear fold changes are also indicated within the heat map boxes. Left boxes indicate the presence of bioYY1 binding and its relative position with respect to transcripts TSS. The bioYY1 target sncRNAs are highlighted in green. YY1 binding intensity is defined using peaks P-value: low >10–40; mediun <10–40 and >10–70; High <10–70. (C) Genomic snapshots of the bioChIPseq results for YY1 and control (FBio-Crtl) at the indicated genomic loci. (D) Distribution of regulated miRNAs upon YY1 down-regulation. Stacked columns show the relative distribution of up-regulated (Up) or down-regulated (Down) miRNAs. (E) Summary of the number of validated target mRNAs of the indicated miRNAs identified in (D). (F) Functional annotation of miRNA targets shown in Figure 3E using miRNAs Ingenuity Systems Pathway Analysis. Top scoring pathways are highlighted in red.
Figure 4.
Figure 4.
YY1 binding sites overlap with Zfx and Myc occupancy. (A) Result of Clover analysis on bioYY1 target promoters. Only the motifs with a score >50 are presented in the table. P-values of each motif relative to the indicated reference set are presented in addition to the score values. (B) K-means clustering of reads intensities in bioYY1 and Zfx ChIPseq data on all bioYY1- and Zfx-associated genomic loci within a 4 kb region centered on peaks’ summits. (C) Overlap between the target genes of the indicated ChIPseq datasets. Target genes are defined by the presence of at least one ChIPseq peak within ±2 kb from genes annotated TSS. P-values of the indicated overlaps are determined by hypergeometric distribution. (D) Examples of the Genomic snapshots generated in bioYY1 and Zfx ChIPseq. (E) As in (B) using bioYY1, c-Myc- and n-Myc-bound genomic loci. (F) Examples of the Genomic snapshots generated in bioYY1, c-Myc and n-Myc ChIPseq. (G) As in (C) with bioYY1, c-Myc and n-Myc target genes. (H) Distribution of YY1 promoters association relative to c-Myc and n-Myc co-occupancy at target genes. Chi-square test determines the P-value.
Figure 5.
Figure 5.
YY1–Myc binding sites are enriched for E2f1 association (A) Heat map of the known DNA binding sites enriched in the different clusters of bio YY1- and Myc-bound promoters by Pscan analysis. Double asterisks denote P < 0.01. (B) As in (A) comparing bioYY1 Myc-bound and not bound target promoters. P-values are indicated within the boxes. Myc binding sites are highlighted in green, E2F binding sites in blue, whereas homeobox-related binding sites in yellow. Position-specific weight matrices (PWM) are shown on the left highlighting the CG rich content of Myc related and the A/T rich content of non-Myc YY1 associated PWMs. (C) K-means clustering of reads intensities in bioYY1, c-Myc, n-Myc and E2f1 ChIPseq data on all bioYY1 c-Myc ad n-Myc associated genomic loci within a 4-kb region centered on the peaks’ summits. (D) Examples of the genomic snapshots generated in bioYY1, c-Myc, n-Myc, E2f1 and H3K27ac ChIPseq.
Figure 6.
Figure 6.
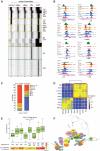
YY1 is part of the Myc TF module and potentiate target genes expression. (A) K-means clustering of reads intensities in the indicated ChIPseq data on bioYY1, c-Myc, n-Myc, Zfx and E2f1 associated genomic loci within a 4-kb region centered on each peaks’ summit. (B) Examples of the genomic snapshots generated in the indicated ChIPseq datasets. (C) Distribution of bioYY1 binding relative to c-Myc, n-Myc, Zfx and E2f1 co-occupancy at target genes. Chi-square test determines the P-value. (D) Heat map of the correlation between the genome-wide associations of the indicated ChIPseq dataset. Two independent Oct4 datasets are included in the analysis. The datasets references are indicated in the ‘Materials and Methods’ section. (E) Box plots of the expression of bioYY1 target genes relative to the co-occupancy of the indicated proteins. P-value was determined by Kruskal–Wallis test. Bottom intensity map highlights the significance of the contribution of bioYY1 binding relative to non-YY1 binding to target gene clusters defined by the co-occupancy of the indicated proteins. P-values are indicated within the boxes and are determined by Wilcoxon test. (F) Model of YY1, Myc, Zfx and E2f1 co-occupancy at target promoters of transcribed genes. The model includes data from previous purifications of Myc complexes from ES cells (23) and speculates on potential transcriptional and post-transcriptional activities of YY1.

Similar articles

Cited by

References

    1. Shi Y, Seto E, Chang LS, Shenk T. Transcriptional repression by YY1, a human GLI-Kruppel-related protein, and relief of repression by adenovirus E1A protein. Cell. 1991;67:377–388. - PubMed
    1. Brown JL, Mucci D, Whiteley M, Dirksen ML, Kassis JA. The Drosophila Polycomb group gene pleiohomeotic encodes a DNA binding protein with homology to the transcription factor YY1. Mol. Cell. 1998;1:1057–1064. - PubMed
    1. Bracken AP, Helin K. Polycomb group proteins: navigators of lineage pathways led astray in cancer. Nat. Rev. Cancer. 2009;9:773–784. - PubMed
    1. Donohoe ME, Zhang X, McGinnis L, Biggers J, Li E, Shi Y. Targeted disruption of mouse Yin Yang 1 transcription factor results in peri-implantation lethality. Mol. Cell Biol. 1999;19:7237–7244. - PMC - PubMed
    1. He Y, Dupree J, Wang J, Sandoval J, Li J, Liu H, Shi Y, Nave KA, Casaccia-Bonnefil P. The transcription factor Yin Yang 1 is essential for oligodendrocyte progenitor differentiation. Neuron. 2007;55:217–230. - PMC - PubMed

Publication types

MeSH terms

Substances