

Functional analysis of the Arabidopsis PLDZ2 promoter reveals an evolutionarily conserved low-Pi-responsive transcriptional enhancer element
- PMID: 22210906
- PMCID: PMC3295404
- DOI: 10.1093/jxb/err446
Functional analysis of the Arabidopsis PLDZ2 promoter reveals an evolutionarily conserved low-Pi-responsive transcriptional enhancer element
Abstract
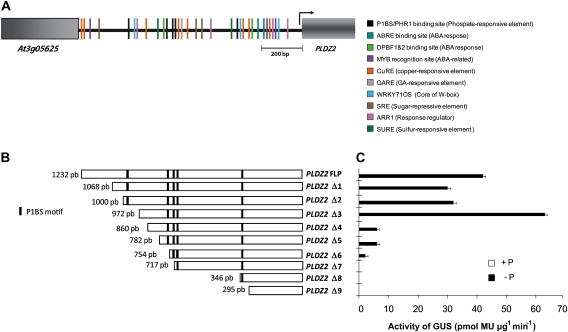
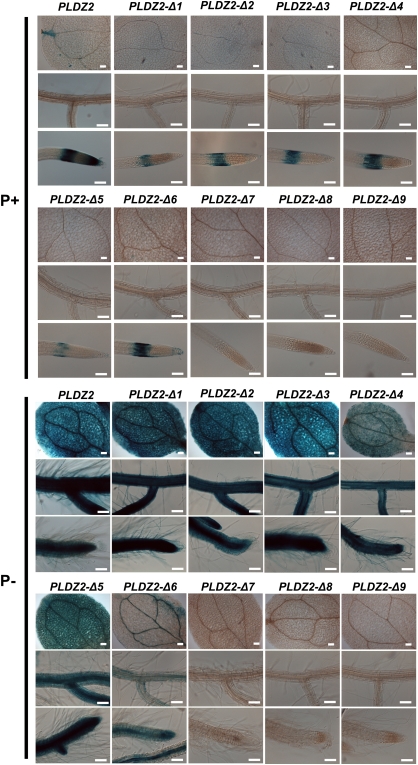
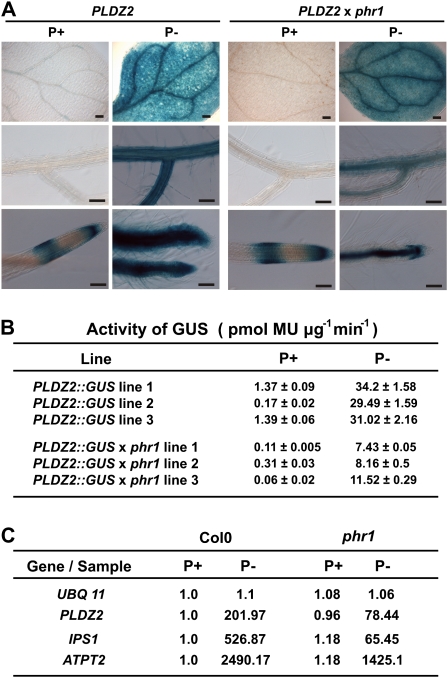
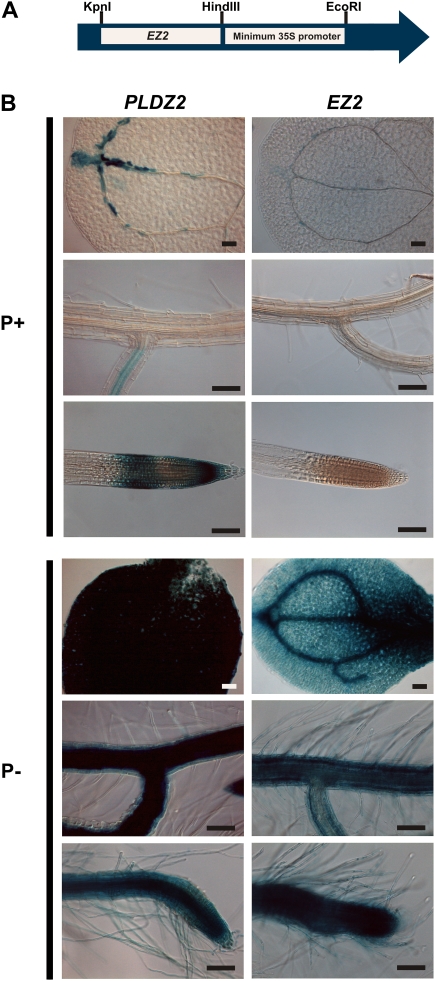
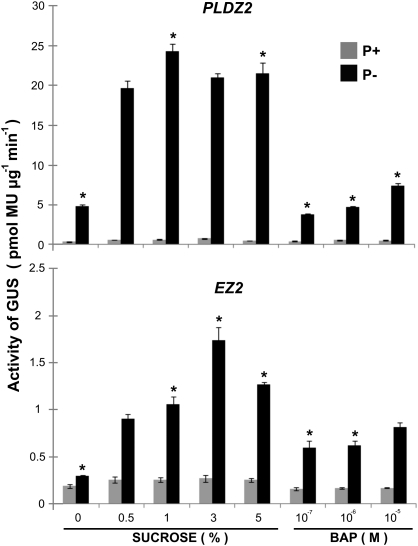
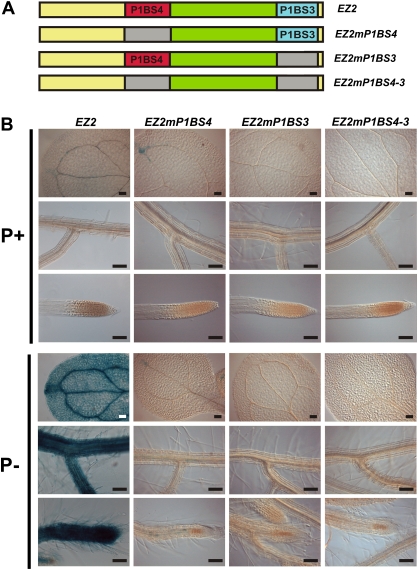
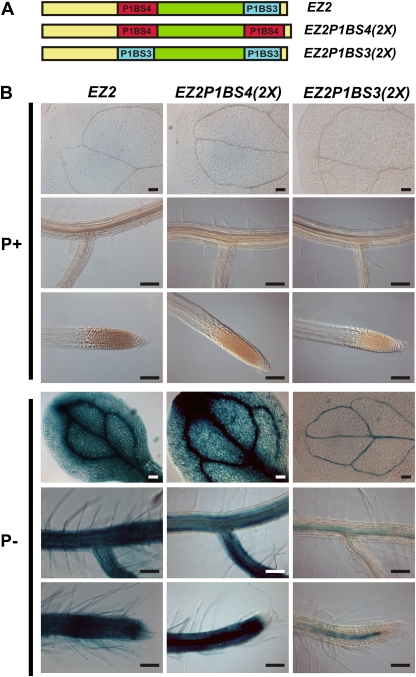
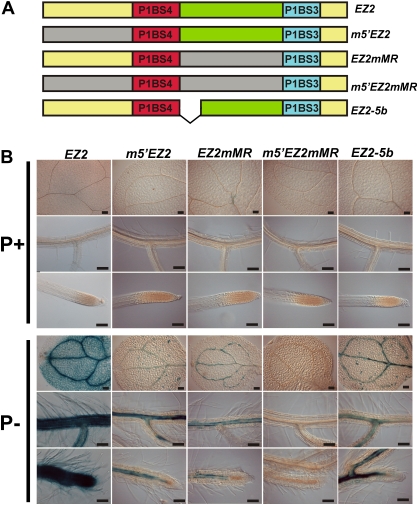
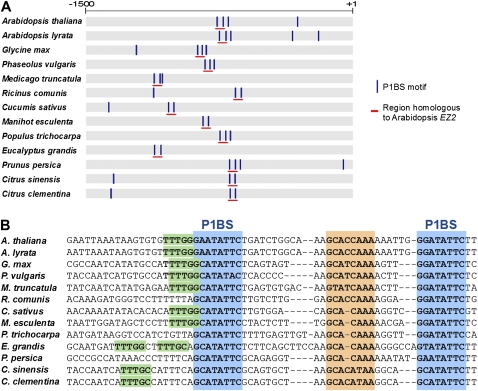
Plants have evolved a plethora of responses to cope with phosphate (Pi) deficiency, including the transcriptional activation of a large set of genes. Among Pi-responsive genes, the expression of the Arabidopsis phospholipase DZ2 (PLDZ2) is activated to participate in the degradation of phospholipids in roots in order to release Pi to support other cellular activities. A deletion analysis was performed to identify the regions determining the strength, tissue-specific expression, and Pi responsiveness of this regulatory region. This study also reports the identification and characterization of a transcriptional enhancer element that is present in the PLDZ2 promoter and able to confer Pi responsiveness to a minimal, inactive 35S promoter. This enhancer also shares the cytokinin and sucrose responsive properties observed for the intact PLDZ2 promoter. The EZ2 element contains two P1BS motifs, each of which is the DNA binding site of transcription factor PHR1. Mutation analysis showed that the P1BS motifs present in EZ2 are necessary but not sufficient for the enhancer function, revealing the importance of adjacent sequences. The structural organization of EZ2 is conserved in the orthologous genes of at least eight families of rosids, suggesting that architectural features such as the distance between the two P1BS motifs are also important for the regulatory properties of this enhancer element.
Figures
Similar articles
-
A specific variant of the PHR1 binding site is highly enriched in the Arabidopsis phosphate-responsive phospholipase DZ2 coexpression network.Plant Signal Behav. 2012 Aug;7(8):914-7. doi: 10.4161/psb.20749. Epub 2012 Jul 27. Plant Signal Behav. 2012. PMID: 22836502 Free PMC article.
-
A central regulatory system largely controls transcriptional activation and repression responses to phosphate starvation in Arabidopsis.PLoS Genet. 2010 Sep 9;6(9):e1001102. doi: 10.1371/journal.pgen.1001102. PLoS Genet. 2010. PMID: 20838596 Free PMC article.
-
Modulation of the Phosphate-Deficient Responses by MicroRNA156 and its Targeted SQUAMOSA PROMOTER BINDING PROTEIN-LIKE 3 in Arabidopsis.Plant Cell Physiol. 2016 Jan;57(1):192-203. doi: 10.1093/pcp/pcv197. Epub 2015 Dec 8. Plant Cell Physiol. 2016. PMID: 26647245
-
Characterization of the AtSPX3 Promoter Elucidates its Complex Regulation in Response to Phosphorus Deficiency.Plant Cell Physiol. 2016 Aug;57(8):1767-78. doi: 10.1093/pcp/pcw100. Epub 2016 May 19. Plant Cell Physiol. 2016. PMID: 27382128
-
A Brassica napus PHT1 phosphate transporter, BnPht1;4, promotes phosphate uptake and affects roots architecture of transgenic Arabidopsis.Plant Mol Biol. 2014 Dec;86(6):595-607. doi: 10.1007/s11103-014-0249-y. Epub 2014 Sep 7. Plant Mol Biol. 2014. PMID: 25194430
Cited by
-
The Role of the P1BS Element Containing Promoter-Driven Genes in Pi Transport and Homeostasis in Plants.Front Plant Sci. 2012 Mar 30;3:58. doi: 10.3389/fpls.2012.00058. eCollection 2012. Front Plant Sci. 2012. PMID: 22639653 Free PMC article.
-
Arabidopsis PHL2 and PHR1 Act Redundantly as the Key Components of the Central Regulatory System Controlling Transcriptional Responses to Phosphate Starvation.Plant Physiol. 2016 Jan;170(1):499-514. doi: 10.1104/pp.15.01336. Epub 2015 Nov 19. Plant Physiol. 2016. PMID: 26586833 Free PMC article.
-
Overexpression of VP, a vacuolar H+-pyrophosphatase gene in wheat (Triticum aestivum L.), improves tobacco plant growth under Pi and N deprivation, high salinity, and drought.J Exp Bot. 2014 Feb;65(2):683-96. doi: 10.1093/jxb/ert442. J Exp Bot. 2014. Retraction in: J Exp Bot. 2016 Apr;67(9):2913. doi: 10.1093/jxb/erw149. PMID: 24474810 Free PMC article. Retracted.
-
Genetic manipulation of a high-affinity PHR1 target cis-element to improve phosphorous uptake in Oryza sativa L.Plant Mol Biol. 2015 Mar;87(4-5):429-40. doi: 10.1007/s11103-015-0289-y. Epub 2015 Feb 6. Plant Mol Biol. 2015. PMID: 25657119
-
Genome-Wide Characterization of DGATs and Their Expression Diversity Analysis in Response to Abiotic Stresses in Brassica napus.Plants (Basel). 2022 Apr 25;11(9):1156. doi: 10.3390/plants11091156. Plants (Basel). 2022. PMID: 35567157 Free PMC article.
References
-
- Andersson MX, Stridh MH, Larsson KE, Liljenberg C, Sandelius AS. Phosphate-deficient oat replaces a major portion of the plasma membrane phospholipids with the galactolipid digalactosyldiacylglycerol. FEBS Letters. 2003;537:128–132. - PubMed
-
- Awai K, Maréchal E, Block MA, Brun D, Masuda T, Shimada H, Takamiya K, Ohta H, Joyard J. Two types of MGDG synthase genes, found widely in both 16:3 and 18:3 plants, differentially mediate galactolipid syntheses in photosynthetic and nonphotosynthetic tissues in Arabidopsis thaliana. Proceedings of the National Academy of Sciences USA. 2001;98:10960–10965. - PMC - PubMed
-
- Bariola PA, Howard CJ, Taylor CB, Verburg MT, Jaglan VD, Green PJ. The Arabidopsis ribonuclease gene RNS1 is tightly controlled in response to phosphate limitation. The Plant Journal. 1994;6:673–685. - PubMed
Publication types
MeSH terms
Substances
Grants and funding
LinkOut - more resources
Full Text Sources
Molecular Biology Databases
Research Materials
Miscellaneous
