

Space-time data fusion under error in computer model output: an application to modeling air quality
- PMID: 22211949
- PMCID: PMC4442701
- DOI: 10.1111/j.1541-0420.2011.01725.x
Space-time data fusion under error in computer model output: an application to modeling air quality
Abstract
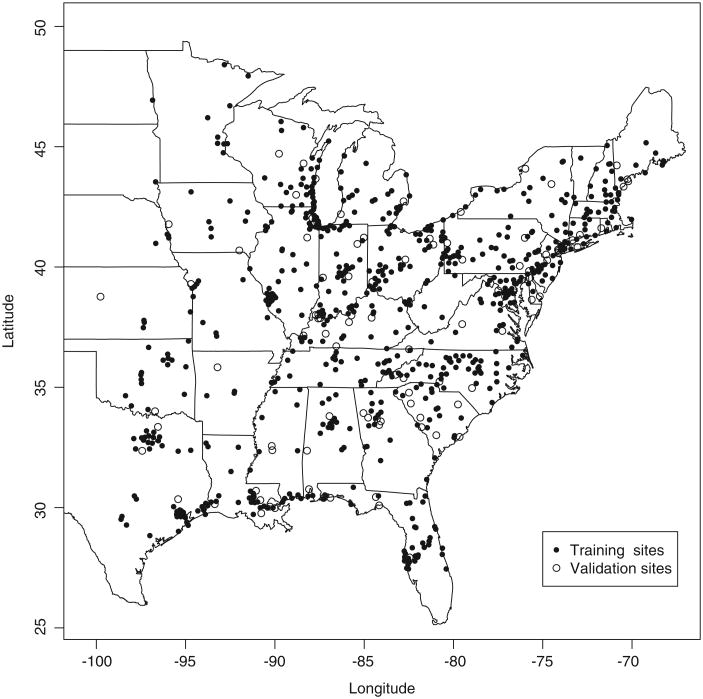
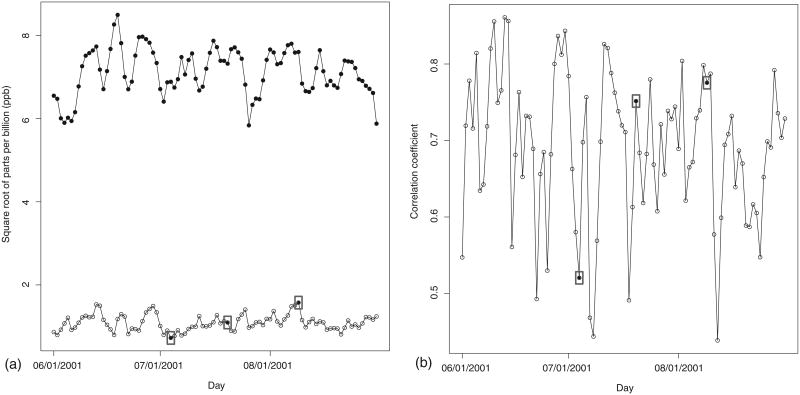
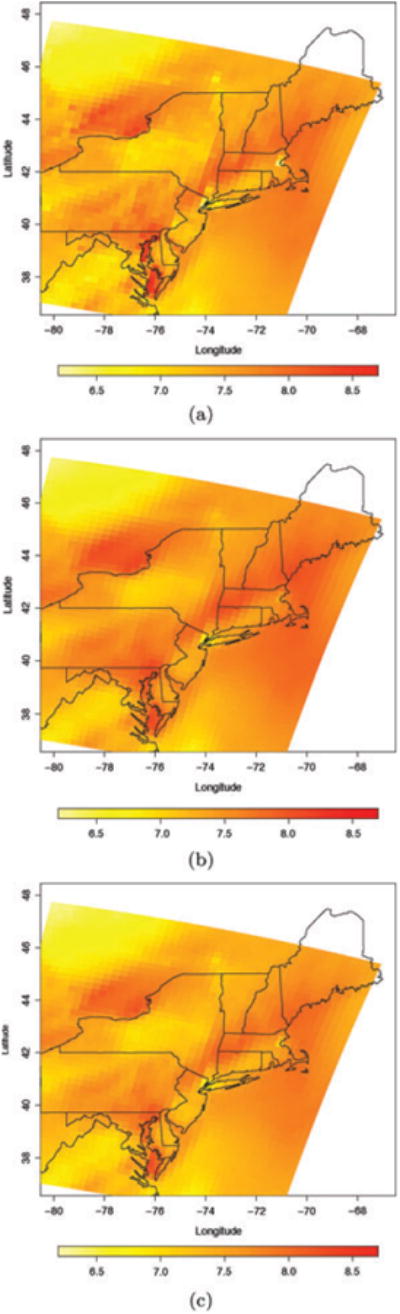
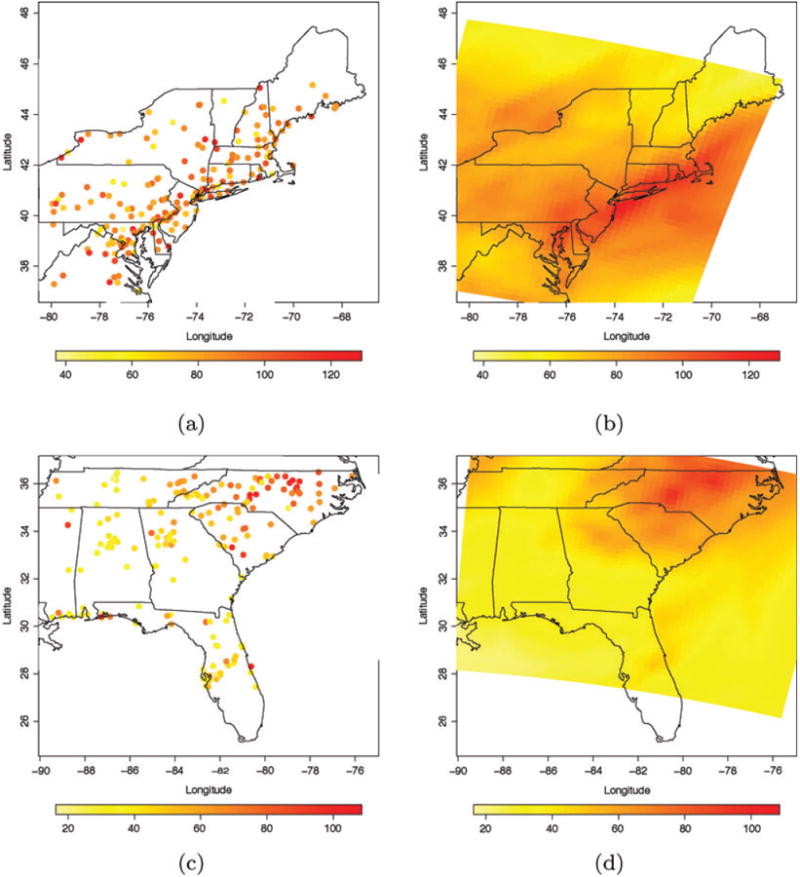
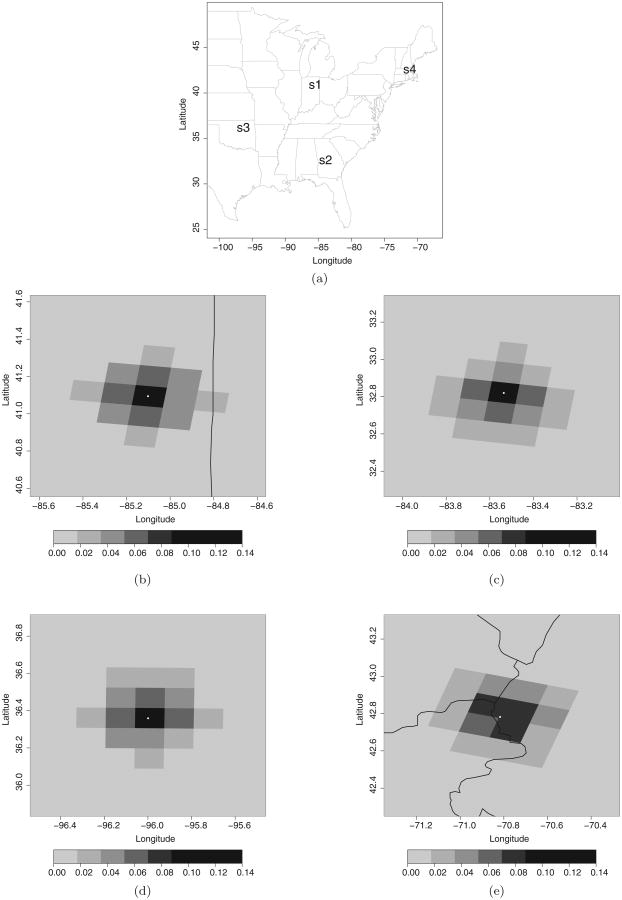
We provide methods that can be used to obtain more accurate environmental exposure assessment. In particular, we propose two modeling approaches to combine monitoring data at point level with numerical model output at grid cell level, yielding improved prediction of ambient exposure at point level. Extending our earlier downscaler model (Berrocal, V. J., Gelfand, A. E., and Holland, D. M. (2010b). A spatio-temporal downscaler for outputs from numerical models. Journal of Agricultural, Biological and Environmental Statistics 15, 176-197), these new models are intended to address two potential concerns with the model output. One recognizes that there may be useful information in the outputs for grid cells that are neighbors of the one in which the location lies. The second acknowledges potential spatial misalignment between a station and its putatively associated grid cell. The first model is a Gaussian Markov random field smoothed downscaler that relates monitoring station data and computer model output via the introduction of a latent Gaussian Markov random field linked to both sources of data. The second model is a smoothed downscaler with spatially varying random weights defined through a latent Gaussian process and an exponential kernel function, that yields, at each site, a new variable on which the monitoring station data is regressed with a spatial linear model. We applied both methods to daily ozone concentration data for the Eastern US during the summer months of June, July and August 2001, obtaining, respectively, a 5% and a 15% predictive gain in overall predictive mean square error over our earlier downscaler model (Berrocal et al., 2010b). Perhaps more importantly, the predictive gain is greater at hold-out sites that are far from monitoring sites.
© 2011, The International Biometric Society.
Figures
References
-
- Banerjee S, Carlin BP, Gelfand AE. Hierarchical Modeling and Analysis for Spatial Data. Boca Raton, FL: Chapman & Hall/CRC; 2004.
-
- Besag J. Spatial interaction and the statistical analysis of lattice systems. Journal of the Royal Statistical Society, Series B. 1974;136:192–236.
