Multicenter Study
. 2012 Jul;17(8):841-54.
doi: 10.1038/mp.2011.177. Epub 2012 Jan 3.

Resting functional connectivity of language networks: characterization and reproducibility

Affiliations
Multicenter Study

Resting functional connectivity of language networks: characterization and reproducibility

D Tomasi et al. Mol Psychiatry. 2012 Jul.

Abstract

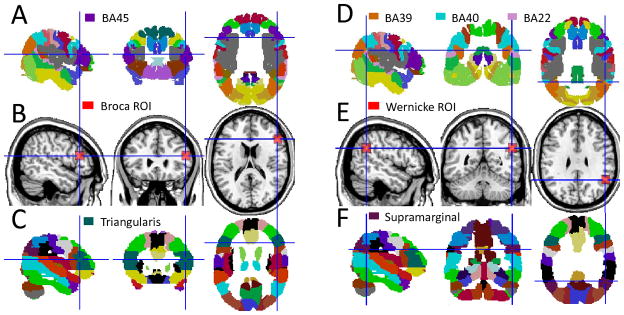
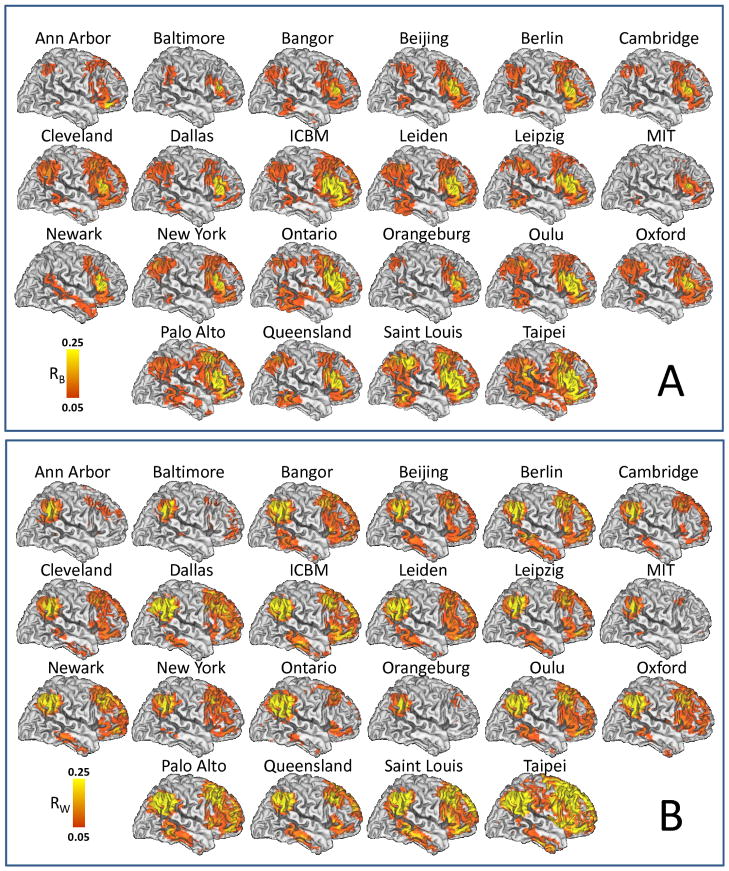
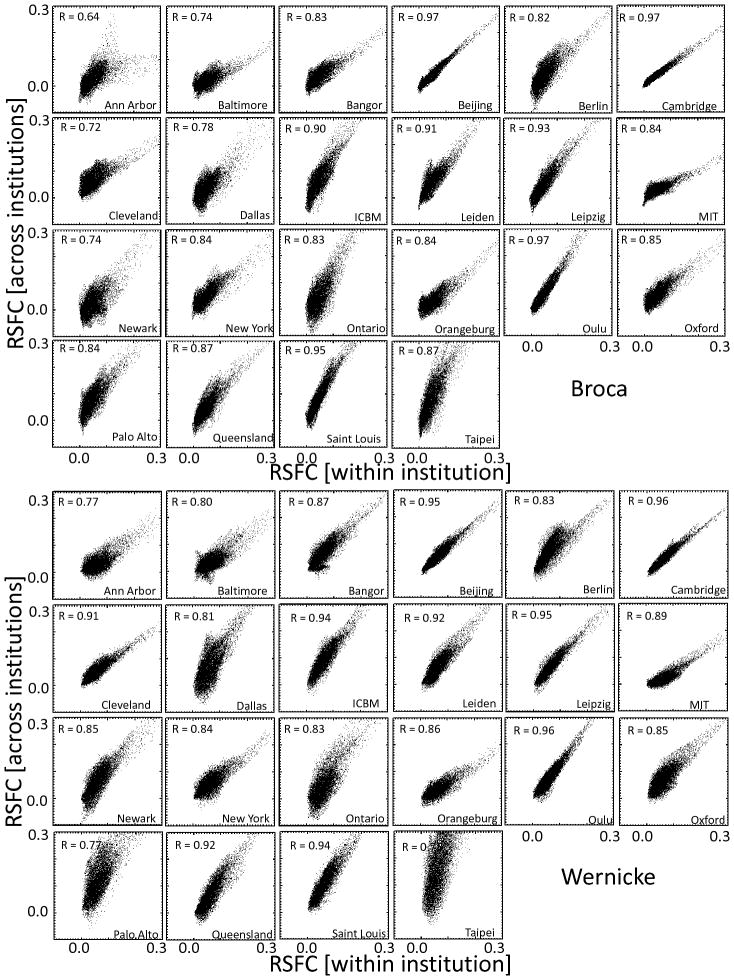
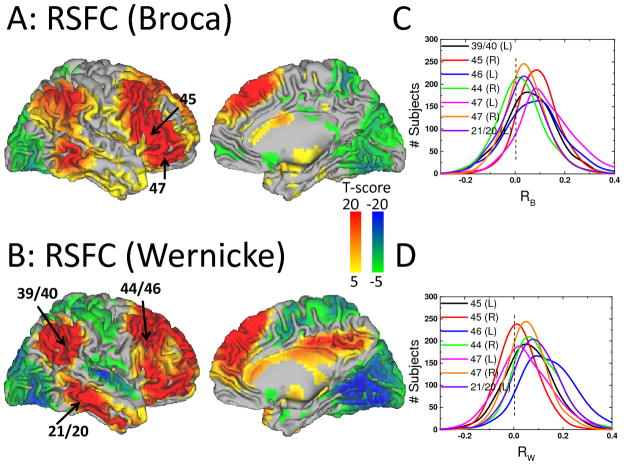
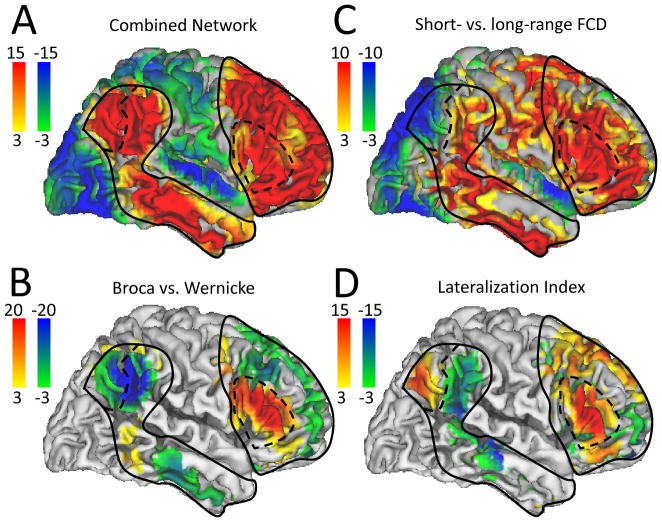
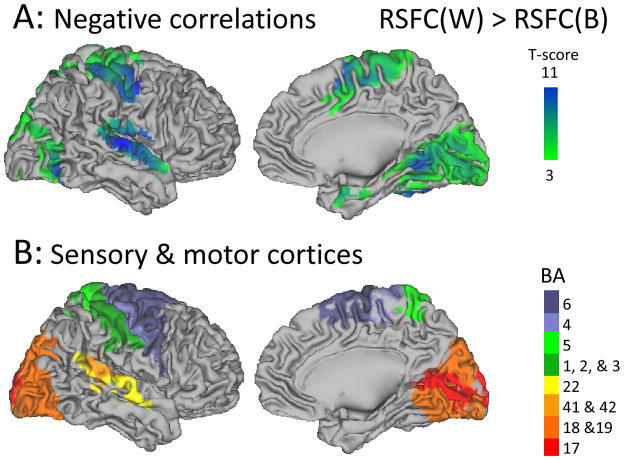
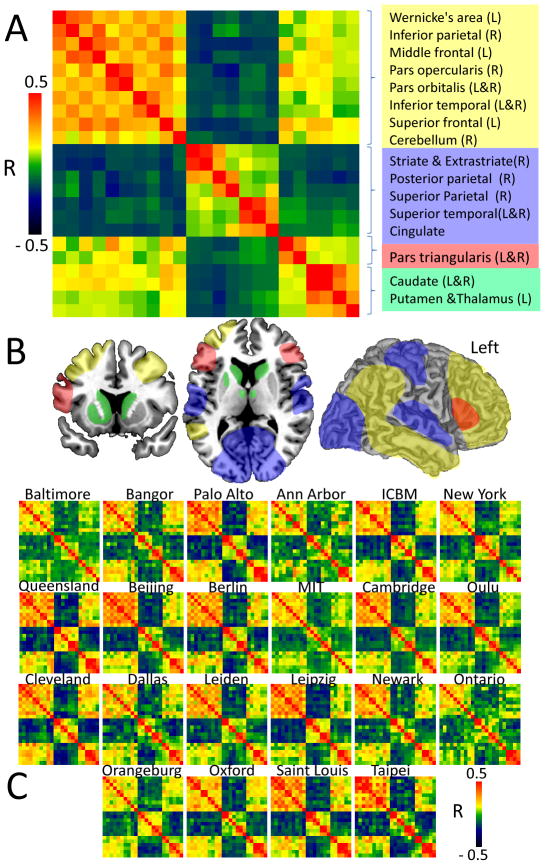
The neural basis of language comprehension and production has been associated with superior temporal (Wernicke's) and inferior frontal (Broca's) cortical areas, respectively. However, recent resting-state functional connectivity (RSFC) and lesion studies have implicated a more extended network in language processing. Using a large RSFC data set from 970 healthy subjects and seed regions in Broca's and Wernicke's, we recapitulate this extended network that includes not only adjoining prefrontal, temporal and parietal regions but also bilateral caudate and left putamen/globus pallidus and subthalamic nucleus. We also show that the language network has predominance of short-range functional connectivity (except posterior Wernicke's area that exhibited predominant long-range connectivity), which is consistent with reliance on local processing. Predominantly, long-range connectivity was left lateralized (except anterior Wernicke's area that exhibited rightward lateralization). The language network also exhibited anti-correlated activity with auditory (only for Wernicke's area) and visual cortices that suggests integrated sequential activity with regions involved with listening or reading words. Assessment of the intra-subject's reproducibility of this network and its characterization in individuals with language dysfunction is required to determine its potential as a biomarker for language disorders.


Figures

Fig 1
Fig 1
Location of seeds (intersecting blue lines) and ROIs (red cubes) used to represent Broca’s and Wernicke’s areas superimposed on three orthogonal views of the human brain (B and E) and on standard probabilistic atlases depicting the anatomical location of Brodmann areas (A and D) and of the gyri implicated in the language network (C and F).
Fig 2
Fig 2
RSFC maps reflecting the average spatial distribution of temporal correlations with time-varying signals in (A) left Broca’s area (RB) and (B) left Wernicke’s area across subjects for each research site in Table 1. Population-average landmark- and surface-based (PALS) atlas of the cerebral cortex; left brain hemisphere. Sample: 970 healthy subjects.
Fig 3
Fig 3
Reproducibility of RSFC patterns from Broca (top panel) and Wernicke (bottom panel). Scatter plots across brain voxels showing the proportionality between the strength of the connectivity for each institution (horizontal axis) and the average connectivity across institutions (averaged across all 970 healthy subjects; vertical axis).
Fig 4
Fig 4
Statistical significance of correlations with time-varying signals in Broca’s (A) and Wernicke’s (B) areas, rendered on lateral and medial cortical views of the brain hemispheres across 970 healthy subjects. Line plots reflect the distribution across subjects of correlations with time-varying signals in Broca’s (RB; C) and Wernicke’s (RW; D) at specific regions-of interest (labels identify Brodman areas in the left, L, and right, R, hemispheres).
Fig 5
Fig 5
Statistical significance (color-coded t-score windows) for: RSFC (RB and RW) (A), differential (short-range – long-range) FCD (B), differential (Broca vs. Wernicke) RSFC (C), and LI for long-range FCD (left hemisphere versus right) (D) superimposed on lateral views of the cortical brain surface. Sample size: 970 (A and B) and 947 (C and D) healthy subjects. Contour lines are the boundaries of the network positively correlated with the seeds (solid line) and potential subdivisions of the network (dashed lines).
Fig 6
Fig 6
Brain surface rendering of statistical significance maps showing the brain regions where the negative correlations were stronger for Wernicke’s seed than for Broca’s seed (t-test; 970 subjects). B: Brain surface rendering of Brodmann Areas (BA) classically associated with primary/association visual (BAs 17–19), auditory (BAs 41, 42 and 22), somatosensory (BAs 1–3 and 5) and motor (BAs 4 and 6) cortices.
Fig 7
Fig 7
Fig 7A: The averaged modular correlation matrix across 970 subjects consists of Pearson correlation coefficients, R, among 23 ROIs (Table 2) and identified four non-overlapping modules: 1-Wernicke’s module, yellow; 2-Anticorrelated module; blue; 3-Broca’s module, red; and 4-thalamic-striatal module. B: Potential spatial partitions of the language network. C: The modular correlation matrices were highly reproducible across the 22 research institutions.

References

    1. Dronkers N, Wilkins D, Van Valin RJ, Redfern B, Jaeger J. Lesion analysis of the brain areas involved in language comprehension. Cognition. 2004;92:145–177. - PubMed
    1. Price C. The anatomy of language: a review of 100 fMRI studies published in 2009. Ann NY Acad Sci. 2010;1191:62–88. - PubMed
    1. Mesulam M. Large-scale neurocognitive networks and distributed processing for attention, language, and memory. Ann Neurol. 1990;28:597–613. - PubMed
    1. Turken A, Dronkers N. The neural architecture of the language comprehension network: converging evidence from lesion and connectivity analyses. Front Syst Neurosci. 2011;5:1–20. - PMC - PubMed
    1. Mesulam M. Imaging connectivity in the human cerebral cortex: the next frontier? Ann Neurol. 2005;57:5–7. - PubMed

Publication types

MeSH terms