. 2012 Jul;33(5):394-404.
doi: 10.1002/bem.21696. Epub 2011 Dec 28.

Cell permeabilization and inhibition of voltage-gated Ca(2+) and Na(+) channel currents by nanosecond pulsed electric field

Affiliations

Cell permeabilization and inhibition of voltage-gated Ca(2+) and Na(+) channel currents by nanosecond pulsed electric field

Vasyl Nesin et al. Bioelectromagnetics. 2012 Jul.

Abstract

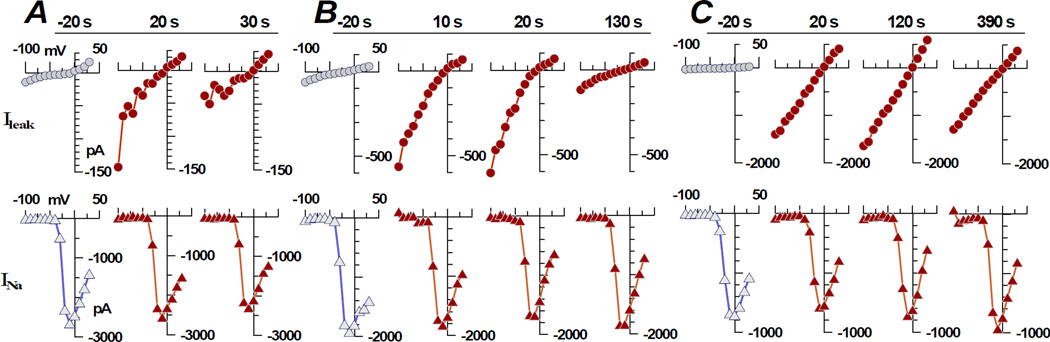
Previous studies have found that nanosecond pulsed electric field (nsPEF) exposure causes long-term permeabilization of the cell plasma membrane. In this study, we utilized the whole-cell patch-clamp method to study the nsPEF effect on currents of voltage-gated (VG) Ca(2+) and Na(+) channels (I(Ca) and I(Na)) in cultured GH3 and NG108 cells. We found that a single 300 or 600 ns pulse at or above 1.5-2 kV/cm caused prolonged inhibition of I(Ca) and I(Na). Concurrently, nsPEF increased a non-inactivating "leak" current (I(leak)), presumably due to the formation of nanoelectropores or larger pores in the plasma membrane. The nsPEF effects were similar in cells that were exposed intact and subsequently brought into the whole-cell recording configuration, and in cells that were first brought into the whole-cell configuration and then exposed. Although both I(leak) and the inhibition of VG currents were enhanced at higher E-field levels, these two nsPEF effects showed relatively weak correlation with each other. In some cells, I(leak) increased 10-fold or more while VG currents remained unchanged. At longer time intervals after exposure (5-15 min), I(Ca) and I(Na) could remain inhibited although I(leak) had largely recovered. The causal relation of nsPEF inhibitory effects on VG currents and permeabilization of the plasma membrane is discussed.


Figures

Fig. 1
Fig. 1
Typical membrane currents and measurement of INa in control and nsPEF-exposed NG108 cells. A: Original current traces in three different cells about 120 s after sham (0 kV/cm) or nsPEF exposure (one 300 ns pulse at 3 kV/cm). Note the fast inactivating inward current (INa) and non-inactivating current (Ileak), which is more pronounced in nsPEF-treated cells. B: Current-voltage (I–V) curves as measured from traces in panel A. The combined current (INa+ Ileak) was measured as a negative peak of current traces during the interval immediately following the voltage step. Ileak was measured as a mean value of non-inactivating currents approximately 10–40 ms after voltage stepping.
Fig. 2
Fig. 2
Effect of E-field amplitude and time interval after exposure (one 300 ns pulse) on INa and non-inactivating Ileak. A: I–V curves for INa measured about 2 min after nsPEF (1.8 and 3 kV/cm) or sham exposure (0 kV/cm). B: Respective Ileak values in the same cells. C: INa and Ileak as measured at indicated time intervals after 3 kV/cm or sham exposure (n=5–8 in each group). Note the fast restoration of Ileak but not INa in nsPEF-treated cells. Holding control cells in the bath for 30 min after sham exposure (rightmost panel) had no effect on the currents.
Fig. 3
Fig. 3
Voltage-gated ICa in GH3 cells and its inhibition by nsPEF. A: Traces of the current elicited by stepping the command voltage from the holding potential of −80 mV to various test potentials (as indicated next to the traces). For clarity, the traces are spatially separated and shown below each other. B: GH3 cells were exposed intact to one 600 ns pulse at 0, 1.2, 2.4, or 3.6 kV/cm. Whole-cell currents were measured about 2 min (top) or 10 min (bottom) after exposure. In the latter groups, cells were allowed to recover for about 9 min prior to being patched. Each graph shows the mean ± SE for 8–15 independent experiments; ICa is identified by the area free of shading.
Fig. 4
Fig. 4
Localized propidium iodide uptake and typical membrane currents following nsPEF exposure. Top: Time change display of fluorescence intensity (pseudocolor) along the line a–b between nsPEF-delivering electrodes. One 300 ns pulse at 4 kV/cm was delivered at 0 s. Middle: Images of the entire cell fluorescence at selected timepoints (identified by dashed lines on the time change display). The left image also shows the position of the line a–b relative to the cell body and recording pipette (outlined for clarity). “+” and “−” signs show directions of nsPEF-delivering electrodes to the anode and cathode. Scale bar: 10 µm. Bottom: I–V curves of Ileak and INa for the same timepoints as the cell images. Note that propidium iodide uptake was delayed after exposure and occurred at the anodic pole of the cell, far from the recording pipette. It was accompanied by profound Ileak enhancement (note the different scale for the rightmost graph), loss of inward rectification, and decrease of INa.
Fig. 5
Fig. 5
Mean changes of INa and Ileak in individual NG108 cells exposed to one 300 ns electric pulse at different E-field intensities. I–V data in each individual cell were collected 20 s prior to and 20 s after nsPEF exposure; the former was then subtracted from the latter. This difference was averaged for all the cells that underwent the same treatment. Note the different vertical scale for Ileak after 1.8 kV/cm.
Fig. 6
Fig. 6
Degree of inhibition of INa as a function of Ileak amplitude in individual cells. Currents were measured 10 s after nsPEF exposure, and the maximum amplitude of INa is expressed as a percentage of its pre-exposure value. Note the lack of inhibition of INa when nsPEF-induced Ileak did not exceed 250 pA. Dashed lines are the best fit power function approximations, separately for Ileak < 250 pA and Ileak > 250 pA. Shaded areas are the 95% confidence intervals of the approximations.
Fig. 7
Fig. 7
Lack of a strict connection between the nsPEF-induced inhibition of voltage-gated INa and the increase in Ileak. A, B, C: Three individual experiments on NG108 cells exposed to a single 300 ns pulse at 1.5 (A and B) or 1.8 kV/cm (C) at 0 s. I–V data are shown for a single timepoint prior to nsEP exposure (−20 s, gray symbols) and for indicated times after.

Comment in

References

    1. Beebe SJ, Fox PM, Rec LJ, Willis EL, Schoenbach KH. Nanosecond, high-intensity pulsed electric fields induce apoptosis in human cells. FASEB J. 2003a;17:1493–1495. - PubMed
    1. Beebe SJ, White J, Blackmore PF, Deng Y, Somers K, Schoenbach KH. Diverse effects of nanosecond pulsed electric fields on cells and tissues. DNA Cell Biol. 2003b;22:785–796. - PubMed
    1. Bowman AM, Nesin OM, Pakhomova ON, Pakhomov AG. Analysis of plasma membrane integrity by fluorescent detection of Tl+ uptake. J Membr Biol. 2010;236:15–26. - PMC - PubMed
    1. Catterall WA. Structure and regulation of voltage-gated Ca2+ channels. Annu Rev Cell Dev Biol. 2000;16:521–555. - PubMed
    1. Catterall WA. Signaling complexes of voltage-gated sodium and calcium channels. Neurosci Lett. 2010;486:107–116. - PMC - PubMed

Publication types

LinkOut - more resources