. 2012 Jan 16;209(1):109-21.
doi: 10.1084/jem.20110399. Epub 2012 Jan 2.

Targeting self- and foreign antigens to dendritic cells via DC-ASGPR generates IL-10-producing suppressive CD4+ T cells

Affiliations

Targeting self- and foreign antigens to dendritic cells via DC-ASGPR generates IL-10-producing suppressive CD4+ T cells

Dapeng Li et al. J Exp Med. .

Abstract

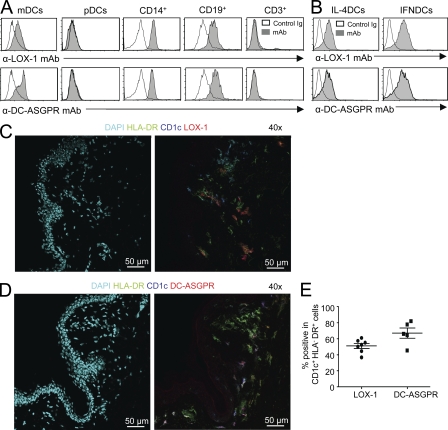
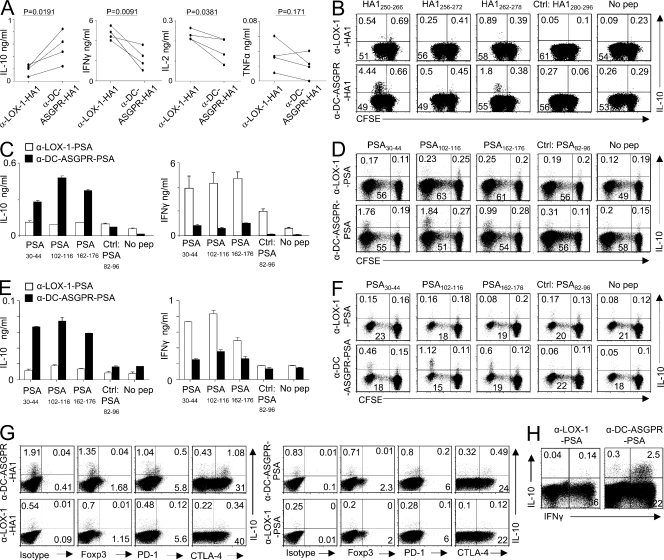
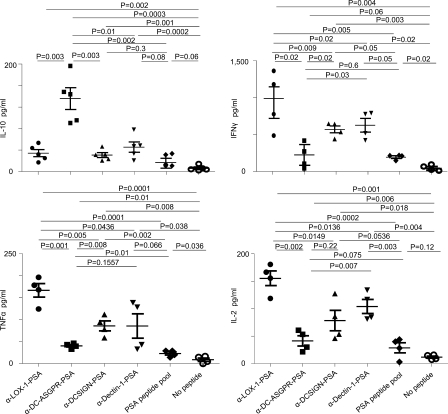
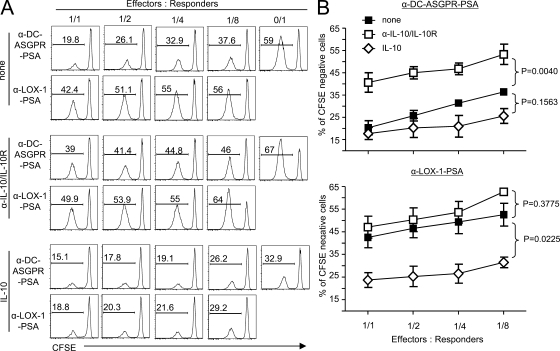
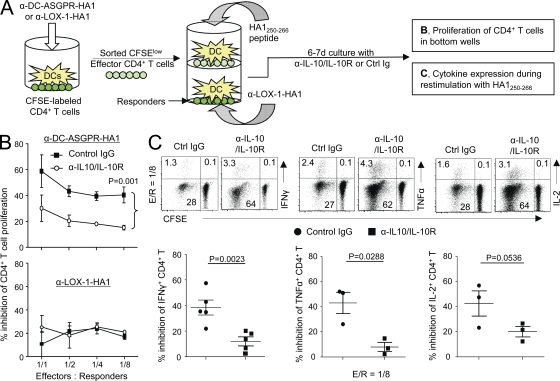
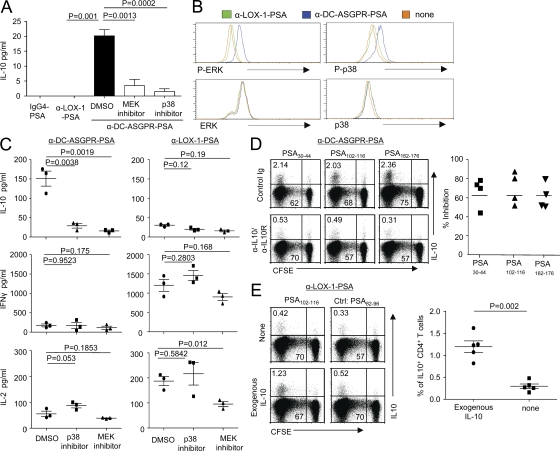
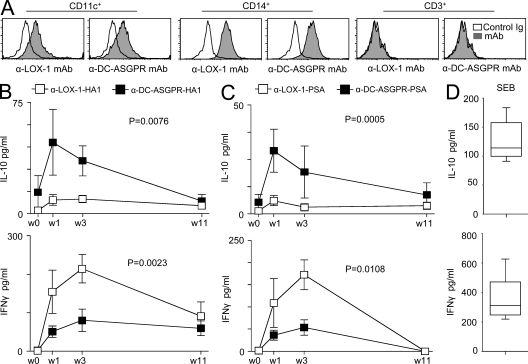
Dendritic cells (DCs) can initiate and shape host immune responses toward either immunity or tolerance by their effects on antigen-specific CD4(+) T cells. DC-asialoglycoprotein receptor (DC-ASGPR), a lectinlike receptor, is a known scavenger receptor. Here, we report that targeting antigens to human DCs via DC-ASGPR, but not lectin-like oxidized-LDL receptor, Dectin-1, or DC-specific ICAM-3-grabbing nonintegrin favors the generation of antigen-specific suppressive CD4(+) T cells that produce interleukin 10 (IL-10). These findings apply to both self- and foreign antigens, as well as memory and naive CD4(+) T cells. The generation of such IL-10-producing CD4(+) T cells requires p38/extracellular signal-regulated kinase phosphorylation and IL-10 induction in DCs. We further demonstrate that immunization of nonhuman primates with antigens fused to anti-DC-ASGPR monoclonal antibody generates antigen-specific CD4(+) T cells that produce IL-10 in vivo. This study provides a new strategy for the establishment of antigen-specific IL-10-producing suppressive T cells in vivo by targeting whole protein antigens to DCs via DC-ASGPR.


Figures

Figure 1.
Figure 1.
DCs express LOX-1 and DC-ASGPR. (A) Expression of LOX-1 (top) and DC-ASGPR (bottom) on the surface of blood myeloid DCs (mDCs; LinHLA-DR+CD11c+CD123), plasmacytoid DCs (pDCs; LinHLA-DR+CD11cCD123+), CD14+ monocytes, CD19+ B cells, and CD3+ T cells. (B) Expression of LOX-1 (top) and DC-ASGPR (bottom) on the surface of monocyte-derived IFNDCs and IL-4DCs. Representative data from experiments using cells from six healthy donors are presented in A and B. Immunofluorescent staining of healthy human skin sections with DAPI, α-HLA-DR, α-CD1c and α-LOX-1 mAb (C), or α-DC-ASGPR (D) labeled with fluorescents. (E) Summary of data generated with skins from two healthy donors. Each dot represents data from one tissue section.
Figure 2.
Figure 2.
Antigen targeting to DCs via DC-ASGPR favors the generation of antigen-specific IL-10–producing CD4+ T cells. IFNDCs (5 × 10³) were loaded with 1 µg/ml α-DC-ASGPR-HA1 or α-LOX-1-HA1, and then co-cultured with CFSE-labeled autologous total CD4+ T cells (1–2 × 10⁵) for 7 d. (A) CD4+ T cells were restimulated with peptide HA1250-266 for 48h, and cytokine levels in the culture supernatants were measured. Each line represents the data from a single experiment. P-values were tested by Student’s t test. (B) CD4+ T cells were restimulated with indicated peptides and stained for intracellular IL-10. HA1280-296 is a negative control. Peptides tested in B had been selected in Fig. S2 (F and G). Four independent experiments showed similar results. (C) Naive CD4+ T cells (1–2 × 10⁵) were co-cultured with IFNDCs (5 × 10³) loaded with 1 µg/ml recombinant fusion proteins for 7 d. CD4+ T cells were restimulated with peptides indicated for 48 h. IL-10 and IFN-γ levels in culture supernatants were assessed. Error bars represent mean ± SEM of triplicate assay. Three independent experiments with 59 PSA-derived peptides showed similar results. (D) Frequency of PSA-specific IL-10–producing CD4+ T cells elicited by recombinant fusion proteins. Four independent experiments showed similar results. (E) Experiments in C were performed with blood mDCs (LinHLA-DR+CD11c+CD123). (F) Experiments in D were performed with blood mDCs. In both E and F, two independent experiments showed similar results. (G) Expression levels of Foxp3, PD-1, and CTLA-4 on HA1250-266-specific (left) and PSA30-44-specific CD4+ T cells producing IL-10 (right). (H) After 7 d of co-culture of purified naive CD4+ T cells and DCs loaded with either α-LOX-1-PSA or α-DC-ASGPR-PSA, CD4+ T cells were stained for intracellular IFN-γ and IL-10 during restimulation with 50 ng/ml PMA and 1 µg/ml ionomycin. Three independent experiments showed similar results (G and H).
Figure 3.
Figure 3.
DC-ASGPR ligation generates antigen-specific IL-10–producing CD4+ T cells. IFNDCs (5 × 10³) were loaded with 1 µg/ml recombinant fusion proteins of PSA, pooled peptides (10 µM), or none overnight. CFSE-labeled autologous naive CD4+ T cells (1–2 × 10⁵) were co-cultured with primed DCs for 7 d. CD4+ T cells were restimulated with 1 µM PSA102-116. After 48 h, IL-10, IFN-γ, TNF, and IL-2 in the culture supernatants were assessed. Each dot represents the data from independent experiments. P-values were calculated by Student’s t test.
Figure 4.
Figure 4.
CD4+ T cells generated with α-DC-ASGPR-PSA suppress allogeneic naive CD4+ T cell proliferation in an IL-10–dependent manner. (A) IFNDCs were loaded with 1 µg/ml α-DC-ASGPR-PSA or α-LOX-1-PSA, and then co-cultured with Qtracker 565–labeled purified autologous naive CD4+ T cells for 7 d. Qtracker 565low CD4+ T cells were sorted as effector cells. Different numbers of effector cells were added into co-cultures of autologous DCs (5 × 10³) loaded with 1 µg/ml α-DC-ASGPR-PSA and newly purified CFSE-labeled allogeneic naive CD4+ T cells as responders (105). Proliferation of allogeneic CD4+ T cells was assessed by measuring CFSE dilution. Two independent experiments with triplicate assay were performed in the presence and absence of 10 µg/ml α–IL-10/IL-10R antibodies or 100 pg/ml IL-10. (B) Summarized data from three independent experiments. Error bars represent SD. Statistical significance was tested by ANOVA.
Figure 5.
Figure 5.
CD4+ T cells generated with α-DC-ASGPR-HA1 suppress HA1-specific IFN-γ–, TNF-, and IL-2–producing CD4+ T cell responses. (A) Experimental scheme for B and C. (B) FACS-sorted CFSElow effector cells generated with α-DC-ASGPR-HA1 (top) or α–LOX-1-HA1 (bottom) were co-cultured with IFNDCs (5 × 10³) loaded with HA1250-266 in the upper wells. Newly purified and CFSE-labeled CD4+ T cells (1–2 × 10⁵) and IFNDCs (5 × 10³) loaded with α–LOX-1-HA1 were co-cultured in the lower wells of trans-well plates. On day 6, proliferation of CD4+ T cells in the lower wells were assessed by measuring CFSE dilution. α–IL-10/IL-10R or control IgG was added. Statistical significance was tested by ANOVA. Three independent experiments showed similar results. Error bars represent SD. (C) Frequency of IFN-γ–, TNF-, and IL-2–expressing CD4+ T cells was measured. Each dot in lower panels represents data from independent experiments. P-values were acquired by Student’s t test.
Figure 6.
Figure 6.
DC-ASGPR ligation induces IL-10 from DCs dependent on ERK/p38 contributing to the generation of antigen-specific IL-10–producing CD4+ T cells. (A) IFNDCs (105) were incubated with indicated inhibitors for 1 h, washed, and loaded with 1 µg/ml IgG4-PSA, α-LOX-1-PSA, or α-DC-ASGPR-PSA. After 24 h, culture supernatants were harvested and IL-10 production was assessed. Error bars indicate the mean ± SEM of two independent experiments with triplicate assay. (B) After 15 min of loading IFNDCs with 1 µg/ml recombinant proteins, α-DC-ASGPR-PSA, or α-LOX-1-PSA, cells were stained with indicated antibodies. Representative data from four independent experiments are presented. (C) 5 × 10³ IFNDCs were treated with 2.5 µM PD0325901 (MEK inhibitor) or SB203580 (p38 inhibitor) for 1 h and washed thoroughly. DCs were loaded with 1 µg/ml α-DC-ASGPR-PSA or α-LOX-1-PSA. CFSE-labeled autologous naive CD4+ T cells (1–2 × 10⁵) were co-cultured for 7 d. CD4+ T cells were then restimulated with 1 µM PSA30-44 for 48 h. IL-10, IFN-γ, and IL-2 in culture supernatants were assessed. Each dot represents the data generated with a single experiment. Background values acquired with control peptide (PSA82-96) were substracted. (D) Purified naive CD4+ T cells (1–2 × 10⁵) were co-cultured with α-DC-ASGPR-PSA–loaded IFNDCs in the presence of control IgG or α–IL-10/IL-10R antibodies for 7 d. Cells were then restimulated with indicated peptides (1 µM) and stained for intracellular IL-10. Summary of the data from four independent experiments are presented on the right. (E) Naive CD4+ T cells (1–2 × 10⁵) were co-cultured for 7 d with IFNDCs (5 × 10³) loaded with 1 µg/ml α-LOX-1-PSA in the presence or absence of 20 pg/ml IL-10. Cells were then restimulated with indicated peptides (1 µM) and stained for intracellular IL-10. Summary of the data from five independent experiments are presented in right panel. P-values were calculated with Student’s t test.
Figure 7.
Figure 7.
Immunization with α-DC-ASGPR-HA1 and α-DC-ASGPR-PSA generates antigen-specific IL-10–producing T cell responses in nonhuman primates. (A) Expression levels of LOX-1 and DC-ASGPR in PBMCs of cynomolgus macaques. (B and C) 12 animals primed and boosted i.d. with live influenza viruses (H1N1, A/PR8/38) were divided into two groups (6 animals/group). One group of animals was immunized i.d. with 250 µg α-LOX-1-HA1 (right arm) and 250 µg α-LOX-1-PSA (left arm). The other group was immunized i.d. with 250 µg α-DC-ASGPR-HA1 (right arm) and 250 µg α-DC-ASGPR-PSA (left arm). After the second boosting with the recombinant fusion proteins, PBMCs (2 × 10⁵ cells/200 µl of medium/well in 96-well plates) were restimulated with 25 µM peptide pools of HA1 (B) or PSA (C), respectively. Cytokines in the culture supernatants were measured by ELISA. Peptide pools of HIVgag were controls. Values presented in B and D are after substraction of control values. Statistical significance was tested by ANOVA. (D) 2 × 10⁵/200 µl PBMCs were stimulated with 0.1 µg/ml Staphylococcal enterotoxin B for 48h. IL-10 and IFN-γ levels in culture supernatants were measured.

References

    1. Akira S., Takeda K., Kaisho T. 2001. Toll-like receptors: critical proteins linking innate and acquired immunity. Nat. Immunol. 2:675–680 10.1038/90609 - DOI - PubMed
    1. Anderson C.F., Oukka M., Kuchroo V.J., Sacks D. 2007. CD4(+)CD25(-)Foxp3(-) Th1 cells are the source of IL-10-mediated immune suppression in chronic cutaneous leishmaniasis. J. Exp. Med. 204:285–297 10.1084/jem.20061886 - DOI - PMC - PubMed
    1. Awasthi A., Carrier Y., Peron J.P., Bettelli E., Kamanaka M., Flavell R.A., Kuchroo V.K., Oukka M., Weiner H.L. 2007. A dominant function for interleukin 27 in generating interleukin 10-producing anti-inflammatory T cells. Nat. Immunol. 8:1380–1389 10.1038/ni1541 - DOI - PubMed
    1. Bacchetta R., Bigler M., Touraine J.L., Parkman R., Tovo P.A., Abrams J., de Waal Malefyt R., de Vries J.E., Roncarolo M.G. 1994. High levels of interleukin 10 production in vivo are associated with tolerance in SCID patients transplanted with HLA mismatched hematopoietic stem cells. J. Exp. Med. 179:493–502 10.1084/jem.179.2.493 - DOI - PMC - PubMed
    1. Banchereau J., Steinman R.M. 1998. Dendritic cells and the control of immunity. Nature. 392:245–252 10.1038/32588 - DOI - PubMed

Publication types