

Impact of the definition of peak standardized uptake value on quantification of treatment response
- PMID: 22213818
- PMCID: PMC3308343
- DOI: 10.2967/jnumed.111.093443
Impact of the definition of peak standardized uptake value on quantification of treatment response
Abstract
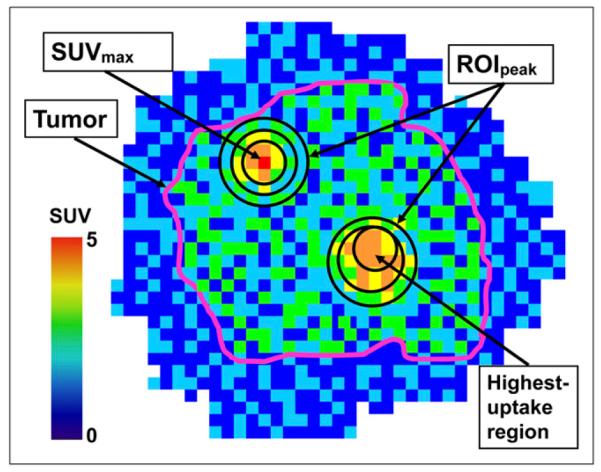
PET-based treatment response assessment typically measures the change in maximum standardized uptake value (SUV(max)), which is adversely affected by noise. Peak SUV (SUV(peak)) has been recommended as a more robust alternative, but its associated region of interest (ROI(peak)) is not uniquely defined. We investigated the impact of different ROI(peak) definitions on quantification of SUV(peak) and tumor response.
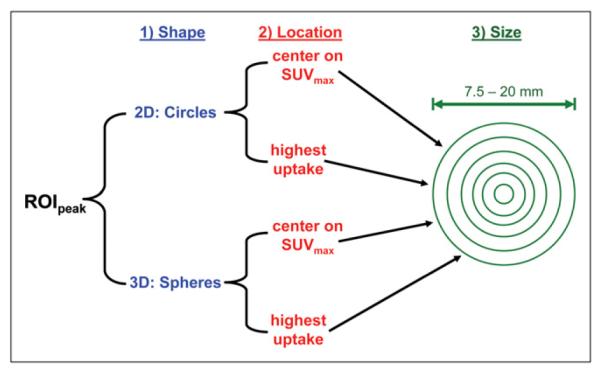
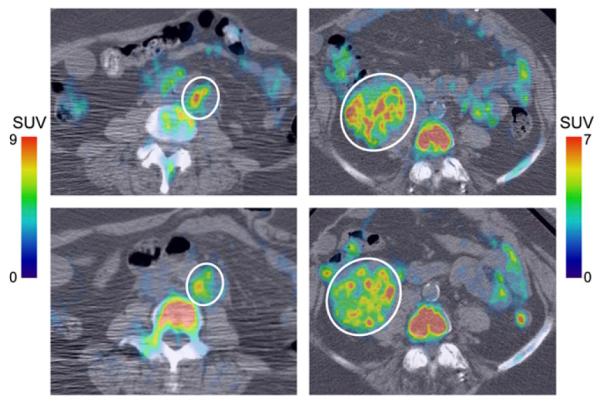
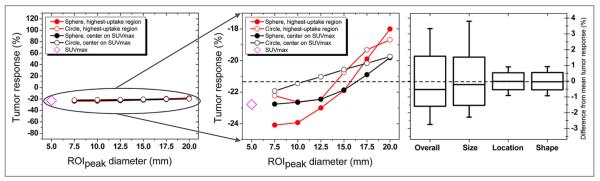
Methods: Seventeen patients with solid malignancies were treated with a multitargeted receptor tyrosine kinase inhibitor resulting in a variety of responses. Using the cellular proliferation marker 3'-deoxy-3'-(18)F-fluorothymidine ((18)F-FLT), whole-body PET/CT scans were acquired at baseline and during treatment. (18)F-FLT-avid lesions (∼2/patient) were segmented on PET images, and tumor response was assessed via the relative change in SUV(peak). For each tumor, 24 different SUV(peaks) were determined by changing ROI(peak) shape (circles vs. spheres), size (7.5-20 mm), and location (centered on SUV(max) vs. placed in highest-uptake region), encompassing different definitions from the literature. Within each tumor, variations in the 24 SUV(peaks) and tumor responses were measured using coefficient of variation (CV), standardized deviation (SD), and range. For each ROI(peak) definition, a population average SUV(peak) and tumor response were determined over all tumors.
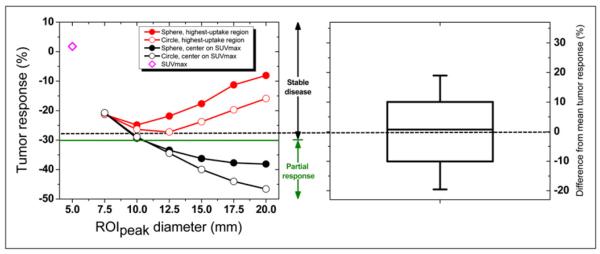
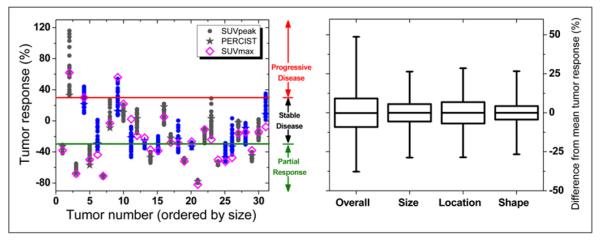
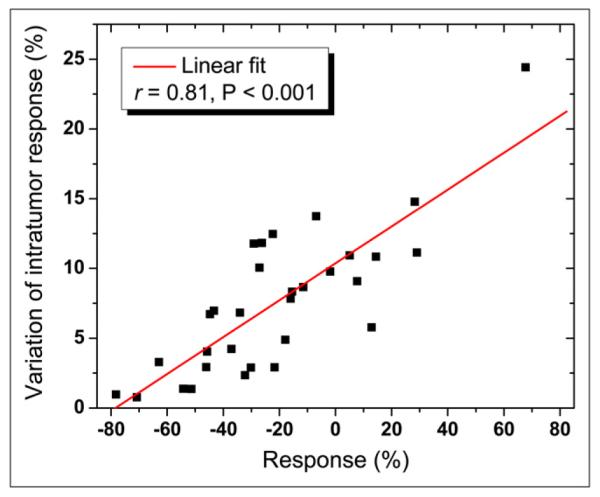
Results: A substantial variation in both SUV(peak) and tumor response resulted from changing the ROI(peak) definition. The variable ROI(peak) definition led to an intratumor SUV(peak) variation ranging from 49% above to 46% below the mean (CV, 17%) and an intratumor SUV(peak) response variation ranging from 49% above to 35% below the mean (SD, 9%). The variable ROI(peak) definition led to a population average SUV(peak) variation ranging from 24% above to 28% below the mean (CV, 14%) and a population average SUV(peak) response variation ranging from only 3% above to 3% below the mean (SD, 2%). The size of ROI(peak) caused more variation in intratumor response than did the location or shape of ROI(peak). Population average tumor response was independent of size, shape, and location of ROI(peak).
Conclusion: Quantification of individual tumor response using SUV(peak) is highly sensitive to the ROI(peak) definition, which can significantly affect the use of SUV(peak) for assessment of treatment response. Clinical trials are necessary to compare the efficacy of SUV(peak) and SUV(max) for quantification of response to therapy.
Figures
References
-
- Weber WA. PET for response assessment in oncology: radiotherapy and chemotherapy. Br J Radiol. 2005;28(suppl):42–49.
-
- Hawkins DS, Schuetze SM, Butrynski JE, et al. [18F]fluorodeoxyglucose positron emission tomography predicts outcome for Ewing sarcoma family of tumors. J Clin Oncol. 2005;23:8828–8834. - PubMed
-
- Ott K, Weber WA, Lordick F, et al. Metabolic imaging predicts response, survival, and recurrence in adenocarcinomas of the esophagogastric junction. J Clin Oncol. 2006;24:4692–4698. - PubMed
-
- Stroobants S, Goeminne J, Seegers M, et al. 18FDG-positron emission tomography for the early prediction of response in advanced soft tissue sarcoma treated with imatinib mesylate (Glivec) Eur J Cancer. 2003;39:2012–2020. - PubMed
-
- Boellaard R, Krak NC, Hoekstra OS, Lammertsma AA. Effects of noise, image resolution, and ROI definition on the accuracy of standard uptake values: a simulation study. J Nucl Med. 2004;45:1519–1527. - PubMed
Publication types
MeSH terms
Grants and funding
LinkOut - more resources
Full Text Sources
Medical