

Is auditory discrimination mature by middle childhood? A study using time-frequency analysis of mismatch responses from 7 years to adulthood
- PMID: 22213909
- PMCID: PMC3083517
- DOI: 10.1111/j.1467-7687.2010.00990.x
Is auditory discrimination mature by middle childhood? A study using time-frequency analysis of mismatch responses from 7 years to adulthood
Abstract
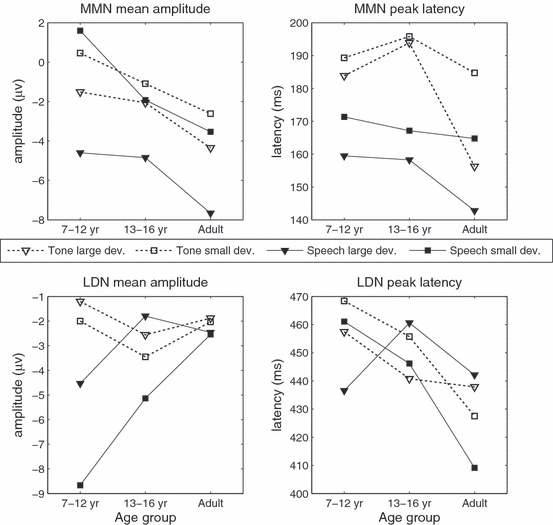
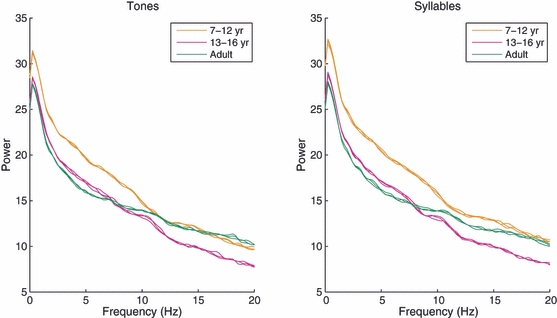
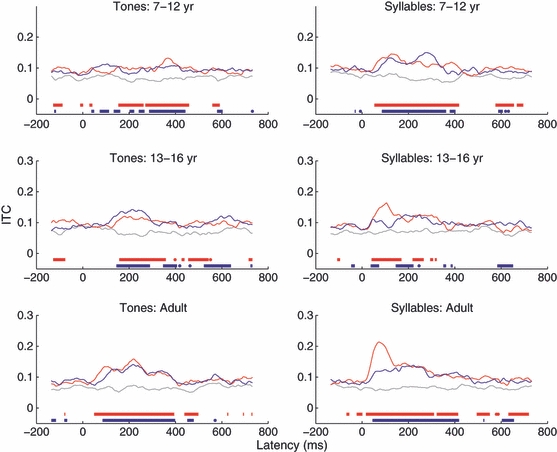
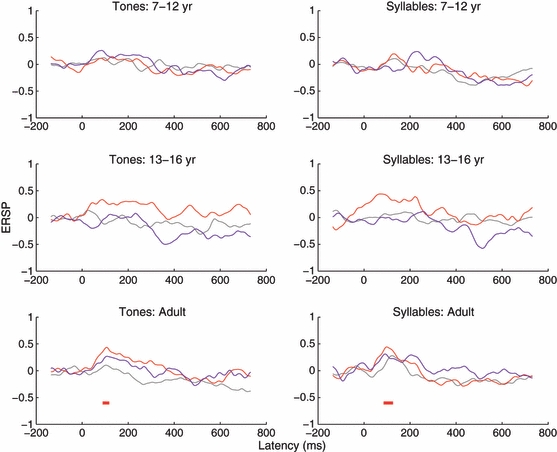
Behavioural and electrophysiological studies give differing impressions of when auditory discrimination is mature. Ability to discriminate frequency and speech contrasts reaches adult levels only around 12 years of age, yet an electrophysiological index of auditory discrimination, the mismatch negativity (MMN), is reported to be as large in children as in adults. Auditory ERPs were measured in 30 children (7 to 12 years), 23 teenagers (13 to 16 years) and 32 adults (35 to 56 years) in an oddball paradigm with tone or syllable stimuli. For each stimulus type, a standard stimulus (1000 Hz tone or syllable [ba]) occurred on 70% of trials, and one of two deviants (1030 or 1200 Hz tone, or syllables [da] or [bi]) equiprobably on the remaining trials. For the traditional MMN interval of 100–250 ms post-onset, size of mismatch responses increased with age, whereas the opposite trend was seen for an interval from 300 to 550 ms post-onset, corresponding to the late discriminative negativity (LDN). Time-frequency analysis of single trials revealed that the MMN resulted from phase-synchronization of oscillations in the theta (4–7 Hz) range, with greater synchronization in adults than children. Furthermore, the amount of synchronization was significantly correlated with frequency discrimination threshold. These results show that neurophysiological processes underlying auditory discrimination continue to develop through childhood and adolescence. Previous reports of adult-like MMN amplitudes in children may be artefactual results of using peak measurements when comparing groups that differ in variance.
Figures
Similar articles
-
Lower-frequency event-related desynchronization: a signature of late mismatch responses to sounds, which is reduced or absent in children with specific language impairment.J Neurosci. 2010 Nov 17;30(46):15578-84. doi: 10.1523/JNEUROSCI.2217-10.2010. J Neurosci. 2010. PMID: 21084613 Free PMC article.
-
Preattentive cortical-evoked responses to pure tones, harmonic tones, and speech: influence of music training.Ear Hear. 2009 Aug;30(4):432-46. doi: 10.1097/AUD.0b013e3181a61bf2. Ear Hear. 2009. PMID: 19494778
-
Electrophysiological and phonological change detection measures of auditory word processing in normal Persian-speaking children.Int J Pediatr Otorhinolaryngol. 2016 Nov;90:220-226. doi: 10.1016/j.ijporl.2016.09.014. Epub 2016 Sep 14. Int J Pediatr Otorhinolaryngol. 2016. PMID: 27729137
-
Atypical central auditory speech-sound discrimination in children who stutter as indexed by the mismatch negativity.J Fluency Disord. 2014 Sep;41:1-11. doi: 10.1016/j.jfludis.2014.07.001. Epub 2014 Jul 15. J Fluency Disord. 2014. PMID: 25066139
-
Neural Underpinnings of Early Speech Perception and Emergent Literacy.Folia Phoniatr Logop. 2019;71(4):146-155. doi: 10.1159/000497058. Epub 2019 Apr 24. Folia Phoniatr Logop. 2019. PMID: 31018199 Review.
Cited by
-
Mu suppression - A good measure of the human mirror neuron system?Cortex. 2016 Sep;82:290-310. doi: 10.1016/j.cortex.2016.03.019. Epub 2016 Apr 15. Cortex. 2016. PMID: 27180217 Free PMC article.
-
Functional brain alterations following mild-to-moderate sensorineural hearing loss in children.Elife. 2019 Oct 1;8:e46965. doi: 10.7554/eLife.46965. Elife. 2019. PMID: 31570117 Free PMC article.
-
Development of auditory change-detection and attentional capture, and their relation to inhibitory control.Psychophysiology. 2023 Apr;60(4):e14211. doi: 10.1111/psyp.14211. Epub 2022 Nov 9. Psychophysiology. 2023. PMID: 36350009 Free PMC article.
-
Early auditory processing dysfunction in schizophrenia: Mechanisms and implications.Neurosci Biobehav Rev. 2023 May;148:105098. doi: 10.1016/j.neubiorev.2023.105098. Epub 2023 Feb 14. Neurosci Biobehav Rev. 2023. PMID: 36796472 Free PMC article. Review.
-
Formant-invariant voice and pitch representations are pre-attentively formed from constantly varying speech and non-speech stimuli.Eur J Neurosci. 2022 Aug;56(3):4086-4106. doi: 10.1111/ejn.15730. Epub 2022 Jun 23. Eur J Neurosci. 2022. PMID: 35673798 Free PMC article.
References
-
- Banai K, Ahissar M. Auditory processing deficits in dyslexia: task or stimulus related? Cerebral Cortex. 2006;16:1718–1728. - PubMed
-
- Başar E, Başar-Eroglu C, Karakas S, Schürmann M. Oscillatory brain theory: a new trend in neuroscience. IEEE Engineering in Medicine and Biology. 1999;18:56–66. - PubMed
-
- Başar E, Başar-Eroglu C, Parnefjord R, Rahn E, Schürmann M. Evoked potentials: ensembles of brain induced rhythmicities in the alpha, theta and gamma ranges. In: Başar E, Bullock TH, editors. Induced rhythms in the brain. Boston, MA: Birkhauser; 1992. pp. 155–181.
-
- Bishop DVM. The Test for Reception of Grammar, version 2 (TROG-2) London: Pearson; 2003.
Publication types
MeSH terms
Grants and funding
LinkOut - more resources
Full Text Sources
