. 2012 Jan 3:10:1.
doi: 10.1186/1741-7007-10-1.

Detailed interrogation of trypanosome cell biology via differential organelle staining and automated image analysis

Affiliations

Detailed interrogation of trypanosome cell biology via differential organelle staining and automated image analysis

Richard J Wheeler et al. BMC Biol. .

Abstract

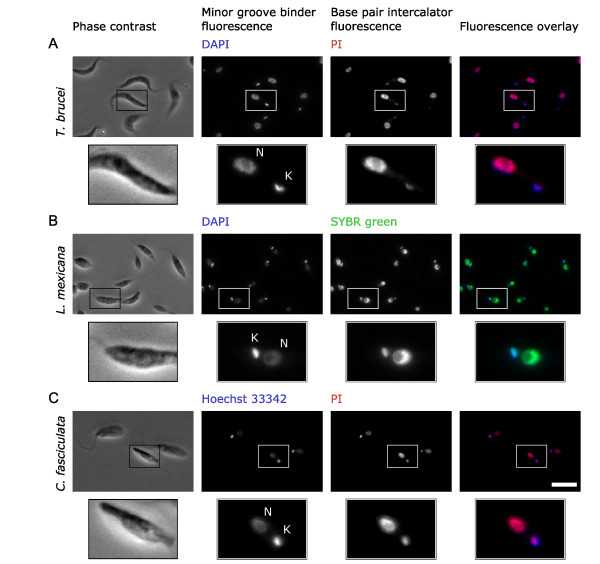
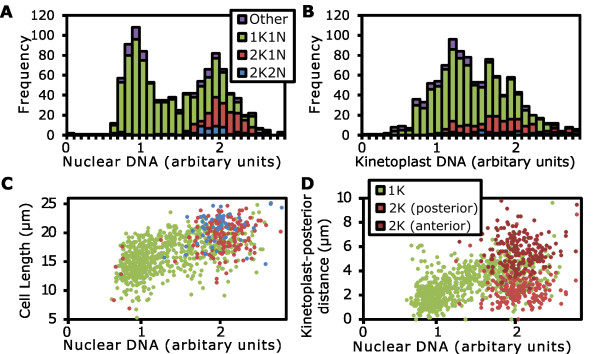
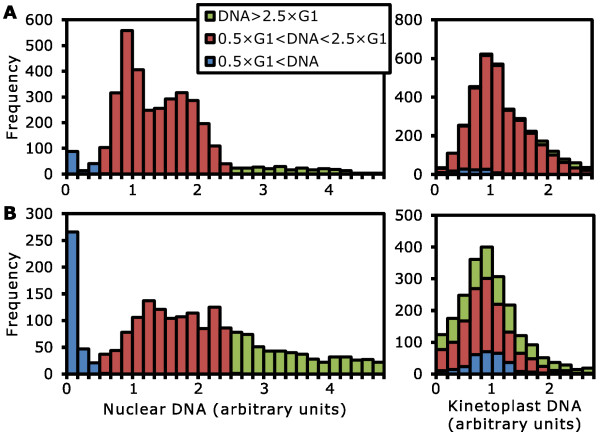
Background: Many trypanosomatid protozoa are important human or animal pathogens. The well defined morphology and precisely choreographed division of trypanosomatid cells makes morphological analysis a powerful tool for analyzing the effect of mutations, chemical insults and changes between lifecycle stages. High-throughput image analysis of micrographs has the potential to accelerate collection of quantitative morphological data. Trypanosomatid cells have two large DNA-containing organelles, the kinetoplast (mitochondrial DNA) and nucleus, which provide useful markers for morphometric analysis; however they need to be accurately identified and often lie in close proximity. This presents a technical challenge. Accurate identification and quantitation of the DNA content of these organelles is a central requirement of any automated analysis method.

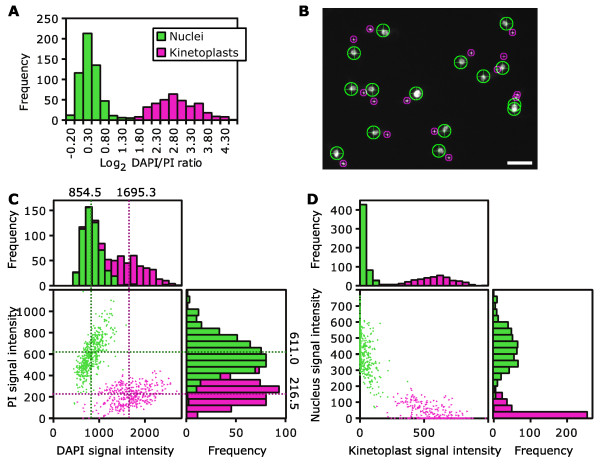
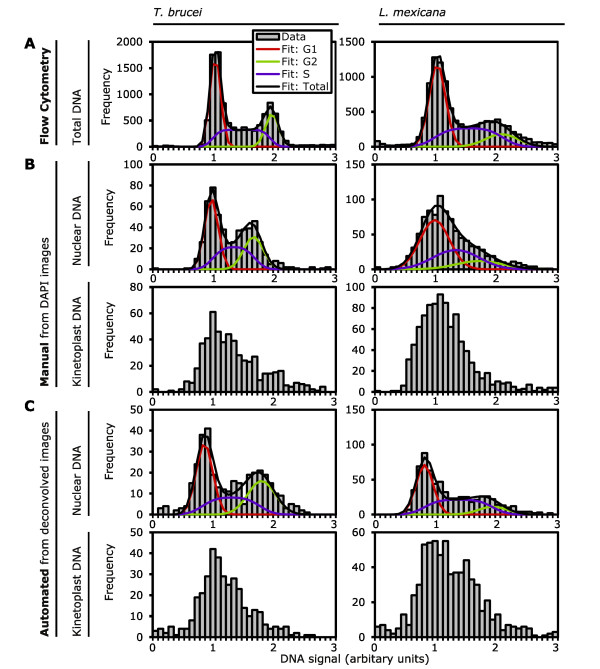
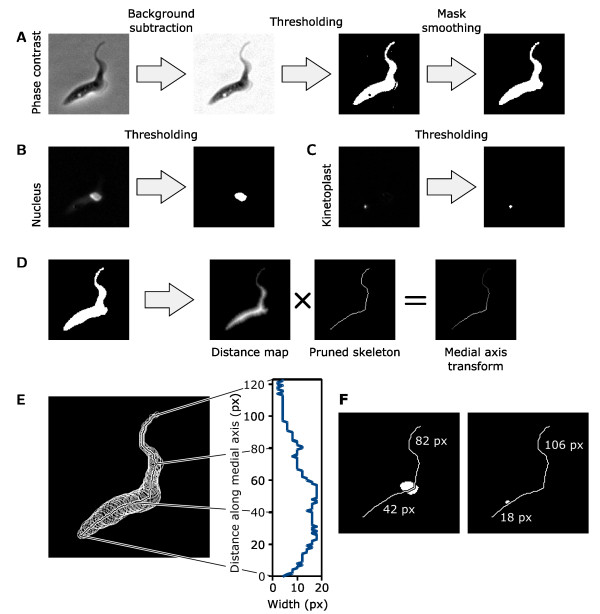
Results: We have developed a technique based on double staining of the DNA with a minor groove binding (4'', 6-diamidino-2-phenylindole (DAPI)) and a base pair intercalating (propidium iodide (PI) or SYBR green) fluorescent stain and color deconvolution. This allows the identification of kinetoplast and nuclear DNA in the micrograph based on whether the organelle has DNA with a more A-T or G-C rich composition. Following unambiguous identification of the kinetoplasts and nuclei the resulting images are amenable to quantitative automated analysis of kinetoplast and nucleus number and DNA content. On this foundation we have developed a demonstrative analysis tool capable of measuring kinetoplast and nucleus DNA content, size and position and cell body shape, length and width automatically.

Conclusions: Our approach to DNA staining and automated quantitative analysis of trypanosomatid morphology accelerated analysis of trypanosomatid protozoa. We have validated this approach using Leishmania mexicana, Crithidia fasciculata and wild-type and mutant Trypanosoma brucei. Automated analysis of T. brucei morphology was of comparable quality to manual analysis while being faster and less susceptible to experimentalist bias. The complete data set from each cell and all analysis parameters used can be recorded ensuring repeatability and allowing complete data archiving and reanalysis.


Figures

Figure 1
Figure 1
Double labeling of kinetoplasts and nuclei with minor groove binding and base pair intercalating DNA stains. (A) Micrographs of procyclic Trypanosoma brucei labeled with 4', 6-diamidino-2-phenylindole (DAPI) and propidium iodide (PI). (B) Promastigote Leishmania mexicana labeled with DAPI and SYBR green. (C) Choanomastigote Crithidia fasciculata labeled with Hoechst 33342 and PI. Lower panels show an enlarged view of individual cells. In each case the kinetoplast (K) appears brighter in the minor groove binding (MGB) stain image (DAPI or Hoechst 33342) than the base pair intercalating (BPI) stain image (PI or SYBR green). The reverse is true for the nucleus (N). For further examples of this effect see Additional file 1. Scale bar represents 10 μm.
Figure 2
Figure 2
Calculation of reference values for and application of color deconvolution. (A) Histogram of log2 4', 6-diamidino-2-phenylindole (DAPI)/propidium iodide (PI) signal ratios from 897 points (single pixels) automatically identified from 3 fields of view of procyclic Trypanosoma brucei stained with DAPI and PI. Each point samples a single kinetoplast or nucleus except in rare cases (<5%) where multiple points were identified per organelle. Points were automatically assigned to either a high log2 ratio (536 points) or a low log2 ratio (361 points) group. (B) An example region of one of the source DAPI fluorescence micrographs used to generate the data in (A). Each point analyzed is marked with a ring color coded to indicate whether it fell into the high (magenta) or low (green) log2 ratio group. Scale bar represents 10 μm. (C) DAPI and PI values of the 897 example points. Points were identified as nuclei or kinetoplasts as described in (A) and (B). The average DAPI and PI signal for kinetoplasts and nuclei, which are the reference values for color deconvolution, are indicated. (D) The kinetoplast and nuclear signal values of the same 897 points following color deconvolution. Color deconvolution acts, using the reference values, to maximize the separation of signal from kinetoplasts and nuclei.
Figure 3
Figure 3
Separation of kinetoplast and nuclear signal by color deconvolution. Micrographs of cells, as shown in Figure 1, before and after color deconvolution. (A) Procyclic Trypanosoma brucei labeled with 4', 6-diamidino-2-phenylindole (DAPI) (minor groove binding (MGB)) and propidium iodide (PI) (base pair intercalating (BPI)). (B) Promastigote Leishmania mexicana labeled with DAPI (MGB) and SYBR green (BPI). (C) Choanomastigote Crithidia fasciculata labeled with Hoechst 33342 (MGB) and PI (BPI). Scale bar represents 5 μm.
Figure 4
Figure 4
Color deconvolution can separate kinetoplast and nuclear DNA signal in Trypanosoma brucei even when the organelles are closely apposed or abnormal in structure. 4', 6-Diamidino-2-phenylindole (DAPI) and propidium iodide (PI) fluorescence and color-deconvolved images of procyclic T. brucei 48 h after induction of expression of sister chromatid cohesion protein 1 (SCC1)-mutAB. (A) 1K1N cell. (B) 2K2N cell. Signal from the closely apposed anterior kinetoplast and posterior nucleus (arrowhead) can be separated. (C) Zoid (1K0N) cell illustrating a lack of nuclear DNA. (D) Cell with zoid-like DAPI staining which possess a fragment of nucleus next to the kinetoplast (arrowhead). (E,F) Cells undergoing aberrant cytokinesis, having failed to undergo mitosis, with a severely distorted nuclear structure. Color deconvolution can unambiguously identify kinetoplasts (arrowheads) among nuclear DNA fragments. (G) An out of focus 2K1N cell; kinetoplast and nucleus signal can still be accurately separated by color deconvolution despite being out of focus. Scale bar represents 5 μm.
Figure 5
Figure 5
Comparison of three methods for quantifying trypanosomatid DNA. The DNA content of exponentially growing procyclic Trypanosoma brucei and promastigote Leishmania mexicana was analyzed by three different methods. (A) Histograms of total DNA content of cells as measured by flow cytometry of propidium iodide (PI)-stained and RNaseA-treated cells (n = 10,000). Kinetoplast and nuclear DNA cannot be quantified separately by this method. (B) Histograms of nuclear and kinetoplast DNA content cells as measured by quantification of signal from manually outlined kinetoplasts and nuclei in 4', 6-diamidino-2-phenylindole (DAPI) fluorescence images of RNaseA-treated cells (T. brucei n = 552, L. mexicana n = 932). (C) Histograms of nuclear and kinetoplast DNA content as measured by quantification of signal within the cell boundary from the kinetoplast and nuclear images generated from color deconvolution of micrographs of cells stained with DAPI and PI (T. brucei, n = 386) or SYBR green (L. mexicana n = 790). Flow cytometry and nuclear DNA histograms were further analyzed by fitting of a model (black line) of the G1 (red), S (purple) and G2 (green) phases of the cell cycle, the results of which are shown in Table 1.
Figure 6
Figure 6
Methods for analysis of trypanosomatid morphology, facilitated by use of color deconvolution. (A) Overview of the image analysis used to identify cells from the phase contrast image. A rolling ball filter was used to remove the phase contrast halo and the resulting image was thresholded then smoothed to generate a cell mask. (B,C) Nuclei and kinetoplasts were identified by thresholding the nucleus and kinetoplast images from color deconvolution. (D) Analysis of cell morphology used the medial axis transform (MAT) of the cell mask, generated by multiplication of the Euclidian distance map and pruned skeleton of the cell mask. (E) The MAT is a line that follows the midline of the cell mask. Values along the MAT encode the half width of the cell at each point; the original mask shape can be reconstructed by placing a circle of the appropriate radius at every point along the MAT (left). Plotting the values of the MAT provides the cell profile shape (right). (F) The distance of the kinetoplast and nucleus from the two ends of the cell were measured along the MAT. The distance from the centroid of the nucleus/kinetoplast to the MAT gave the distance from the cell midline.
Figure 7
Figure 7
Automated analysis of procyclic Trypanosoma brucei DNA content, shape and organelle positioning. Logarithmically growing procyclic T. brucei were analyzed using 4', 6-diamidino-2-phenylindole (DAPI) and SYBR green staining followed by color deconvolution and automated image analysis of DNA content and morphology. (A) Histogram of the nuclear DNA content of cells broken down by kinetoplast and nucleus number; 1K1N (green), 2K1N (red), 2K2N (blue) and other (purple). (B) Histogram of the kinetoplast DNA content of cells broken down by kinetoplast and nucleus number as in (A). (C) Scatter plot of cell length against nuclear DNA content for 1K1N, 2K1N and 2K2N cells, color coded as in (A). (D) Scatter plot of kinetoplast position against nuclear DNA content. Points are shown in green for cells with a single kinetoplast and red for cells with two kinetoplasts. The more posterior kinetoplast in 2K cells is shown in the lighter shade of red.
Figure 8
Figure 8
Quantitation of nuclear DNA loss and increase in a procyclic Trypanosoma brucei cell line following induction of expression of sister chromatid cohesion protein 1 (SCC1)-mutAB. Procyclic T. brucei before and 48 h after induction of expression of SCC1-mutAB were analyzed using 4', 6-diamidino-2-phenylindole (DAPI) and propidium iodide (PI) staining followed by color deconvolution and automated image analysis of DNA content and morphology. (A) Histograms of nuclear (left) and kinetoplast (right) DNA content of the uninduced cell line. Cells were categorized as normal (red), abnormally low (blue) or abnormally high (green) nuclear DNA content. (B) Histograms of nuclear (left) and kinetoplast (right) DNA content, at the same scale as (A), following induction for 48 h. Cells were categorized as normal, low or high nuclear DNA content based on the uninduced cell line. The proportion of cells with abnormally low or high nuclear DNA content has increased. Cells with abnormally high or low nuclear DNA content show no skew towards high or low kinetoplast DNA content.

Similar articles

Cited by

References

    1. Borst P, van der Ploeg M, van Hoek JF, Tas J, James J. On the DNA content and ploidy of trypanosomes. Mol Biochem Parasitol. 1982;6:13–23. doi: 10.1016/0166-6851(82)90049-4. - DOI - PubMed
    1. Henriksson J, Aslund L, Pettersson U. Karyotype variability in Trypanosoma cruzi. Parasitol Today. 1996;12:108–114. doi: 10.1016/0169-4758(96)80670-3. - DOI - PubMed
    1. Hoare CA, Wallace FG. Developmental stages of trypanosomatid flagellates: a new terminology. Nature. 1966;212:1385–1386. doi: 10.1038/2121385a0. - DOI
    1. Sherwin T, Gull K. The cell division cycle of Trypanosoma brucei brucei: timing of event markers and cytoskeletal modulations. Philos Trans R Soc Lond B Biol Sci. 1989;323:573–588. doi: 10.1098/rstb.1989.0037. - DOI - PubMed
    1. Wheeler RJ, Gluenz E, Gull K. The cell cycle of Leishmania: morphogenetic events and their implications for parasite biology. Mol Microbiol. 2011;79:647–662. doi: 10.1111/j.1365-2958.2010.07479.x. - DOI - PMC - PubMed

Publication types

MeSH terms