. 2012 Mar 1;52(5):951-61.
doi: 10.1016/j.freeradbiomed.2011.12.001. Epub 2011 Dec 23.

Myeloperoxidase-derived oxidants inhibit sarco/endoplasmic reticulum Ca2+-ATPase activity and perturb Ca2+ homeostasis in human coronary artery endothelial cells

Affiliations

Myeloperoxidase-derived oxidants inhibit sarco/endoplasmic reticulum Ca2+-ATPase activity and perturb Ca2+ homeostasis in human coronary artery endothelial cells

Naomi L Cook et al. Free Radic Biol Med. .

Abstract

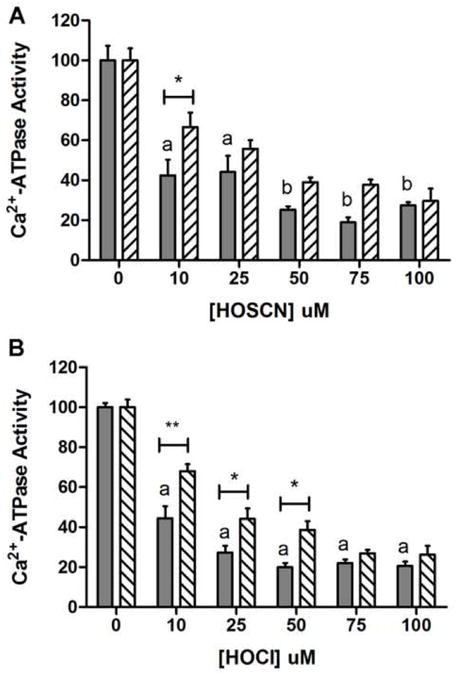
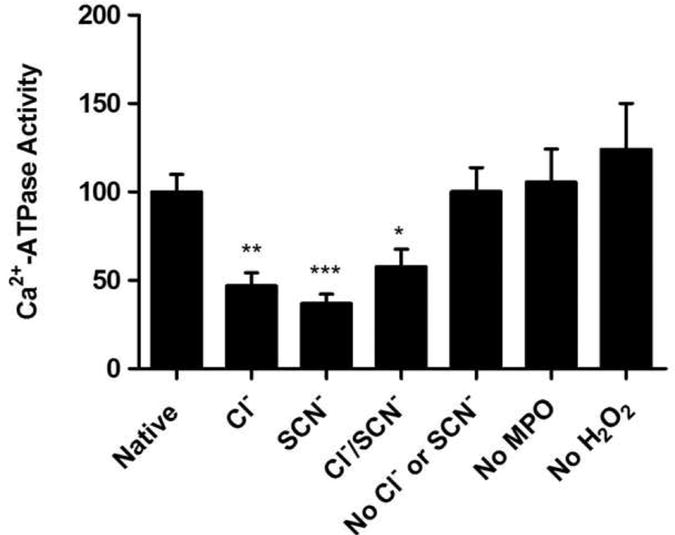
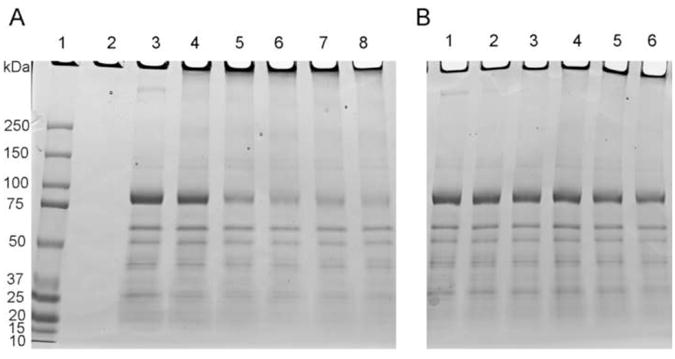
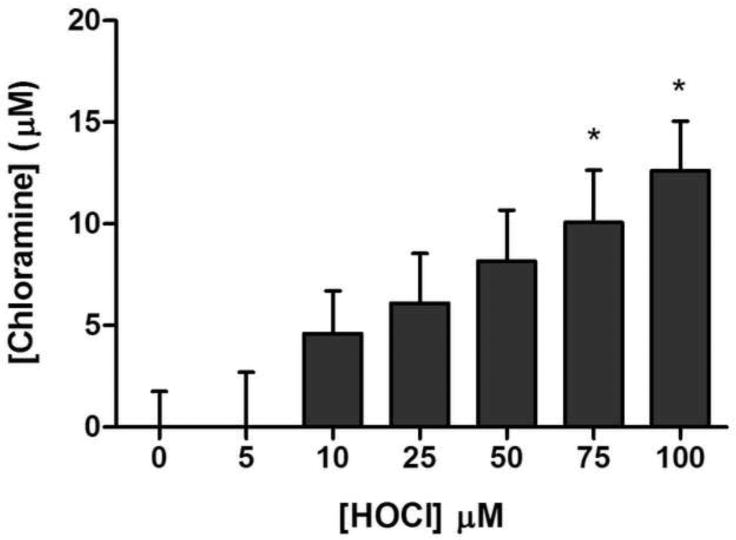
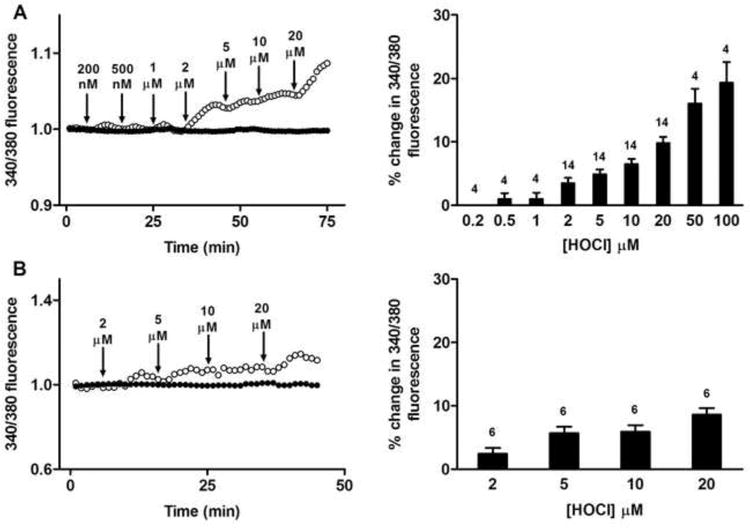
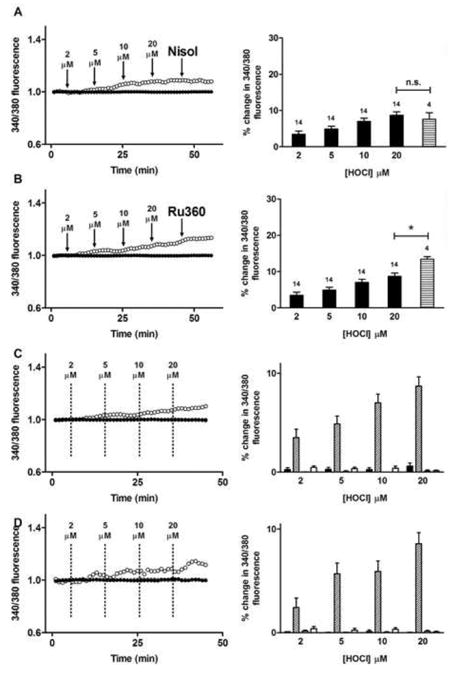
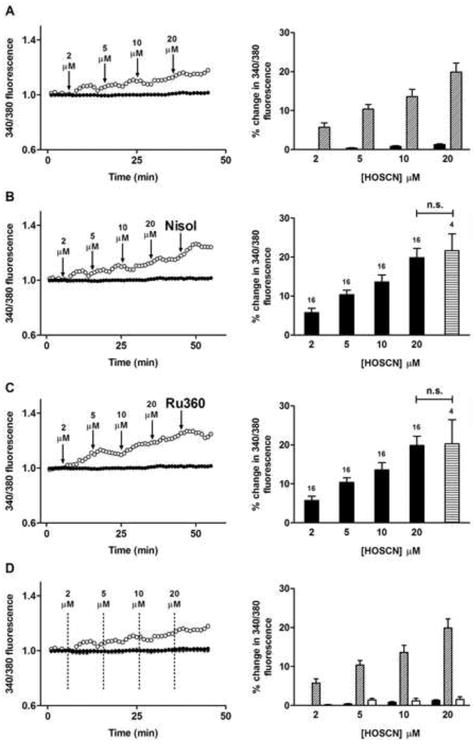
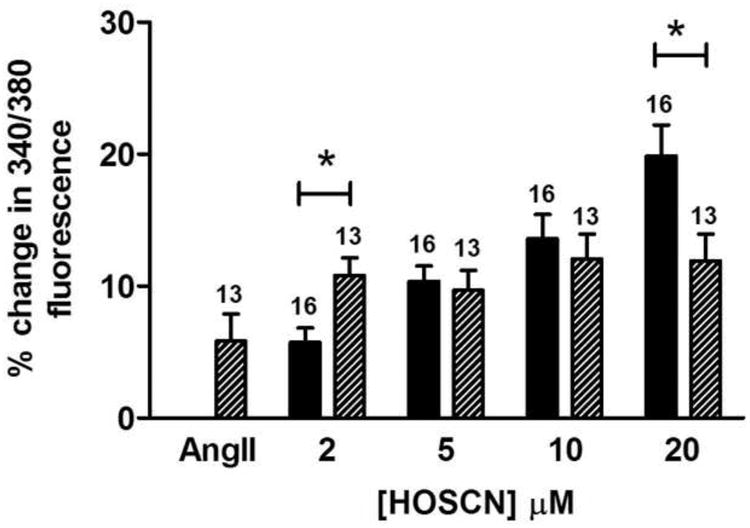
The sarco/endoplasmic reticulum Ca(2+)-ATPase (SERCA) plays a critical role in Ca(2+) homeostasis via sequestration of this ion in the sarco/endoplasmic reticulum. The activity of this pump is inhibited by oxidants and impaired in aging tissues and cardiovascular disease. We have shown previously that the myeloperoxidase (MPO)-derived oxidants HOCl and HOSCN target thiols and mediate cellular dysfunction. As SERCA contains Cys residues critical to ATPase activity, we hypothesized that HOCl and HOSCN might inhibit SERCA activity, via thiol oxidation, and increase cytosolic Ca(2+) levels in human coronary artery endothelial cells (HCAEC). Exposure of sarcoplasmic reticulum vesicles to preformed or enzymatically generated HOCl and HOSCN resulted in a concentration-dependent decrease in ATPase activity; this was also inhibited by the SERCA inhibitor thapsigargin. Decomposed HOSCN and incomplete MPO enzyme systems did not decrease activity. Loss of ATPase activity occurred concurrent with oxidation of SERCA Cys residues and protein modification. Exposure of HCAEC, with or without external Ca(2+), to HOSCN or HOCl resulted in a time- and concentration-dependent increase in intracellular Ca(2+) under conditions that did not result in immediate loss of cell viability. Thapsigargin, but not inhibitors of plasma membrane or mitochondrial Ca(2+) pumps/channels, completely attenuated the increase in intracellular Ca(2+) consistent with a critical role for SERCA in maintaining endothelial cell Ca(2+) homeostasis. Angiotensin II pretreatment potentiated the effect of HOSCN at low concentrations. MPO-mediated modulation of intracellular Ca(2+) levels may exacerbate endothelial dysfunction, a key early event in atherosclerosis, and be more marked in smokers because of their higher SCN(-) levels.


Figures

Fig. 1
Fig. 1
HOSCN and HOCl inhibit the Ca2+-ATPase activity in SR vesicles. (a) Ca2+-ATPase activity, attributed to SERCA, was measured after exposure to 0-100 μM freshly prepared HOSCN for 2 h (solid-filled bars), with subsequent exposure to 2.5 mM dithiothreitol (DTT) for 30 min (hatched bars) at 21 °C and pH 7.0. (b) As (a) except treatment with 0-100 μM HOCl for 1 h (solid-filled bars), and subsequent exposure to DTT (hatched bars). For both (a) and (b), data are expressed as mean + SEM of SERCA activity compared to native SR vesicles (0 μM HOCl). Letters depict statistically significant differences in activity between oxidant-treated and control vesicles by one-way ANOVA with Dunnett's post-hoc tests (a, P < 0.01; b, P < 0.001). Two-way ANOVA was carried out with Bonferroni post-hoc tests to compare data at each oxidant concentration; asterisks depict statistically significant differences between the absence and presence of DTT treatment.
Fig. 2
Fig. 2
Oxidants generated by MPO inhibit SR Ca2+-ATPase activity. SR Ca2+-ATPase activity as measured after incubation with complete or incomplete MPO systems for 1 h at 21 °C and pH 7.0. The complete MPO system consisted of: 0.5 mg mL−1 SR, 100 nM MPO and 50 μM H2O2 plus either: 10 mM MgCl2 and 1× SSC buffer, pH 7.0 (to generate HOCl only); or 10 mM MgSO4, 50 μM NaSCN and 5 mM MOPS, pH 7.0 (to generate HOSCN only); or 10 mM MgCl2, 50 μM NaSCN and 1× SSC buffer, pH 7.0 (to generate both HOCl and HOSCN). Control samples containing no MPO, no H2O2, no NaSCN and no Cl individually, were also examined. Data are expressed as mean + SEM of SERCA activity compared to native SR vesicles, with statistical analysis carried out using one-way ANOVA with Dunnett's post-hoc tests.
Fig. 3
Fig. 3
Exposure of SR vesicles to HOSCN and HOCl alters the electrophoretic mobility of SERCA protein as assessed by SDS-PAGE separation of native and oxidant-treated SR vesicles with subsequent Coomassie Blue staining. (a) Treatment of SR with 0-100 μM freshly prepared HOSCN resulted in a concentration-dependent loss of the SERCA band, and an increase in high molecular mass aggregates in the wells of the gel. Lane 1: Molecular mass markers; lane 2: negative control; lane 3: Native SR (0 μM HOSCN); Lanes 4-8: SR treated with 10, 25, 50, 75 and 100 μM HOSCN, respectively. (b) As (a) except with HOCl. Lane 1: native SR (0 μM HOCl); lanes 2-6: SR treated with 10, 25, 50, 75 and 100 μM HOCl, respectively.
Fig. 4
Fig. 4
Exposure of SR preparations to HOSCN and HOCl results in oxidation of thiol groups as assessed using the ThioGlo assay. (a) SR were treated with 0-100 μM HOSCN for 2 h at 21 °C and pH 7.0, followed by SDS denaturation for 30 min at 37 °C. Black bars indicate concentration of free thiol groups, and hatched bars the corresponding Ca2+-ATPase activity. (b) As (a) except with 0-100 μM HOCl for 1 h. Bars depict mean + SEM of thiol groups or SERCA activity. In both (a) and (b) oxidant-induced thiol loss relative control SR was assessed by one-way ANOVA with Dunnett's post-hoc tests, with letters depicting statistically significant difference versus the untreated control (a, P < 0.05; b, P < 0.01; c, P < 0.001). Two-way ANOVA with Bonferroni post-hoc tests was used to compare thiol loss and SERCA activity data at each oxidant concentration: asterisks denote statistically-significant differences between these two parameters at the P < 0.05 level. (c) and (d), SDS-PAGE separation of native and oxidant-treated SR labeled with the fluorescent thiol tag, IAF; (c) treatment with HOSCN, (d) treatment with HOCl. For both gels: lane 1 is a negative control; lane 2, native SR (0 μM oxidant); lanes 3-7: SR treated with 10, 25, 50, 75 and 100 μM oxidant, respectively. The band at ∼ 100 kDa is assigned to SERCA.
Fig. 5
Fig. 5
Quantification of chloramine formation on SR vesicle proteins on exposure to HOCl. SR vesicles were exposed to 0-100 μM HOCl for 15 min at 21 °C and pH 7.0, and chloramines subsequently quantified by reaction with TNB at 412 nm. Bars depict mean + SEM of chloramine concentration, with statistical analysis carried out using one-way ANOVA with Dunnett's post-hoc tests compared to native SR.
Fig. 6
Fig. 6
Exposure of human coronary artery endothelial cells (HCAEC) to HOCl increases intracellular calcium levels as detected by Fura-2AM fluorescence. (A) Left panel: Fura-2AM 340/380 nm fluorescence (340/380 fluorescence) recorded from HCAEC before and after exposure to increasing concentrations of HOCl (open circles), and untreated (control) HCAEC (filled circles). Arrows indicate sequential HOCl additions at the indicated concentrations. Right panel: quantification of the changes from multiple cells with increasing HOCl concentrations with data expressed as mean + SEM of % changes in 340/380 fluorescence. Numbers above bars represent n (cell number). (B) As (A), except with cells present in Ca2+-free media.
Fig. 7
Fig. 7
Internal calcium stores contribute to the increase in intracellular calcium observed in HCAEC after exposure to HOCl. (A) Left panel: Fura-2AM 340/380 nm fluorescence recorded from HCAEC before and after exposure to increasing concentrations of HOCl (open circles) followed by 4 μM nisoldipine (Nisol) as indicated, and untreated (control) HCAEC (filled circles). Arrows indicate time points of sequential HOCl additions at the stated concentrations and addition of Nisol. Right panel: quantification of the changes from multiple cells with increasing HOCl concentrations (black bars) and nisoldipine (horizontal striped bar). Numbers above bars represent n (cell number). (B) As (A) except with HOCl and 4 μM Ru360 (horizontal striped bar); * P < 0.05. (C) Fura-2AM 340/380 nm fluorescence recorded from HCAEC before and after exposure to increasing concentrations of HOCl (open circles), increasing concentrations of HOCl after pretreatment with 3 μM thapsigargin for 10 min (cross symbols), and untreated (control) HCAEC (filled circles). Dashed lines indicate time points of sequential HOCl additions at the stated concentrations. Right panel: quantification of changes with increasing concentrations of HOCl. Black bars, untreated cells (n = 8); diagonally hatched bars, HOCl treated cells (n = 14); grey bars, thapsigargin-treated cells in absence of HOCl (n = 4); white bars, thapsigargin-treated cells in presence of HOCl (n = 12). (D) As panel (C), except cells were present in media that did not contain Ca2+. Black bars, untreated cells (n = 6); diagonally hatched bars, HOCl-treated cells (n = 6); grey bars, thapsigargin-treated cells in absence of HOCl (n = 8); white bars, thapsigargin-treated cells in presence of HOCl (n = 16). Data in right panels are expressed as mean + SEM of % changes in 340/380 fluorescence.
Fig. 8
Fig. 8
Exposure of HCAEC to HOSCN increases intracellular calcium. (A) Left panel: Fura-2AM 340/380 nm fluorescence (340/380 fluorescence) recorded from HCAEC before and after exposure to increasing concentrations of HOCl in the presence of 10 mM NaSCN to generate HOSCN (open circles), and HCAEC exposed to 10 mM NaSCN only (filled circles). Arrows indicate time points of sequential HOCl treatments at the stated concentrations. Right panel: quantification of the changes from multiple cells exposed to increasing concentrations of HOSCN. Black bars, cells exposed to 10 mM NaSCN only (n = 16); white bars, cells exposed to HOSCN generated from HOCl in the presence of 10 mM NaSCN (n = 16). (B) Left panel: as (A) except with 4 μM nisoldipine (Nisol) in the presence of 10 mM NaSCN, with arrows indicating time points of HOSCN treatment and Nisol addition. Right panel: quantification of the changes from multiple cells exposed to increasing concentrations of HOSCN and nisoldopine (horizontal striped bar). Numbers above bars represent n (cell number). (C) As (A) and (B), except with 4 μM Ru360 (horizontal striped bar). (D) Fura-2AM 340/380 nm fluorescence recorded from HCAEC before and after exposure to increasing concentrations of HOSCN (open circles, generated from 10 mM NaSCN plus HOCl), increasing concentrations of HOSCN (cross symbols) after pretreatment with 3 μM thapsigargin for 10 min, and HCAEC treated with 10 mM NaSCN alone (filled circles). Dashed lines indicate time points of sequential HOSCN additions at the stated concentrations. Right panel: quantification of changes with increasing concentrations of HOSCN. Black bars, cells exposed to 10 mM NaSCN alone (n = 16); diagonally hatched bars, cells exposed to HOSCN generated from HOCl in the presence of 10 mM NaSCN (n = 16); white bars, cells pre-treated with 3 μM thapsigargin for 10 min exposed to HOSCN generated from HOCl in the presence of 10 mM NaSCN (n = 12). Data in all right panels are expressed as mean + SEM of % changes in 340/380 fluorescence.
Fig. 9
Fig. 9
Effect of Ang II on HOSCN mediated changes in intracellular calcium. Fura 2 fluorescence was recorded in cells before and after exposure to Ang II (1 nM) for 10 min to determine baseline changes induced by Ang II. HCAECs were then treated with increasing concentrations of HOSCN. Dashed bars are treatment with Ang II alone (bar labeled AngII) or Ang II plus the stated concentration of HOSCN. Black bars are control cells (no Ang II) treated with the stated levels of HOSCN. The number of experiments are indicated above each bar. * indicates P < 0.05 for the Ang II pre-treatment with HOSCN, versus HOSCN alone.

Similar articles

Cited by

References

    1. Davies MJ. Myeloperoxidase-derived oxidation: mechanisms of biological damage and its prevention. J Clin Biochem Nutr. 2011;48:8–19. - PMC - PubMed
    1. Davies MJ, Hawkins CL, Pattison DI, Rees MD. Mammalian heme peroxidases: from molecular mechanisms to health implications. Antioxid Redox Signal. 2008;10:1199–1234. - PubMed
    1. van der Veen BS, de Winther MP, Heeringa P. Myeloperoxidase: molecular mechanisms of action and their relevance to human health and disease. Antioxid Redox Signal. 2009;11:2899–2937. - PubMed
    1. Zhang R, Brennan ML, Fu X, Aviles RJ, Pearce GL, Penn MS, Topol EJ, Sprecher DL, Hazen SL. Association between myeloperoxidase levels and risk of coronary artery disease. JAMA. 2001;286:2136–2142. - PubMed
    1. Brennan ML, Penn MS, Van Lente F, Nambi V, Shishehbor MH, Aviles RJ, Goormastic M, Pepoy ML, McErlean ES, Topol EJ, Nissen SE, Hazen SL. Prognostic value of myeloperoxidase in patients with chest pain. N Engl J Med. 2003;349:1595–1604. - PubMed

Publication types

MeSH terms