. 2012 Mar;180(3):1107-1120.
doi: 10.1016/j.ajpath.2011.11.016. Epub 2011 Dec 31.

Neural stem cell depletion and CNS developmental defects after enteroviral infection

Affiliations

Neural stem cell depletion and CNS developmental defects after enteroviral infection

Chelsea M Ruller et al. Am J Pathol. 2012 Mar.

Abstract

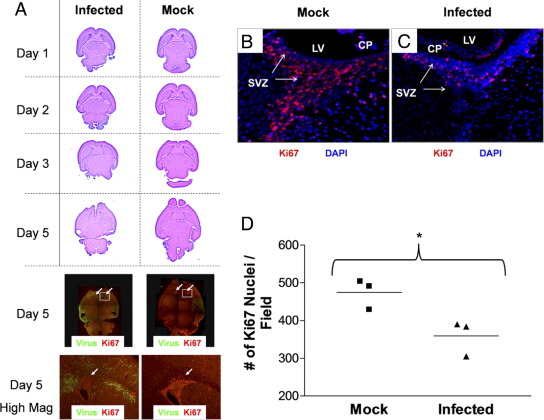
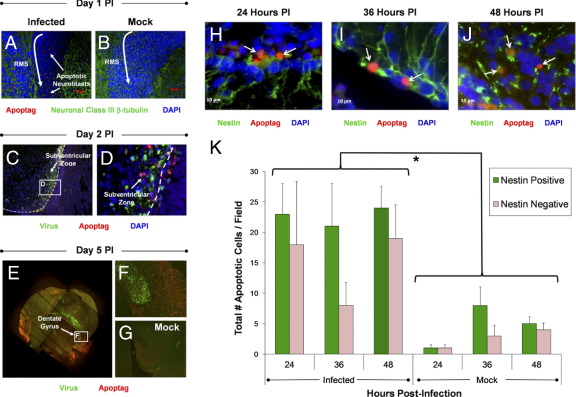
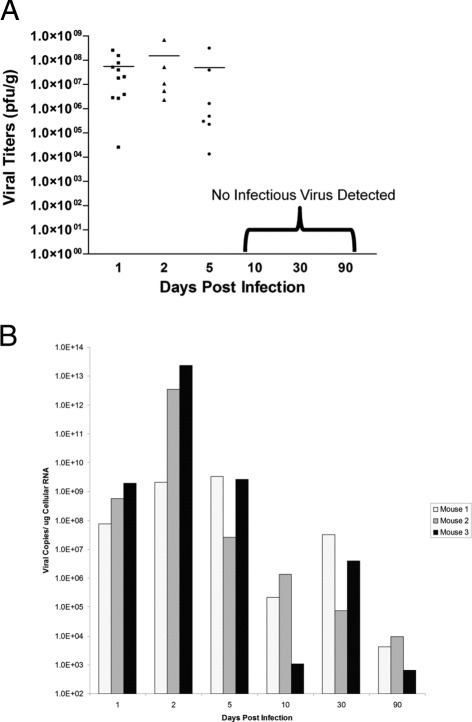
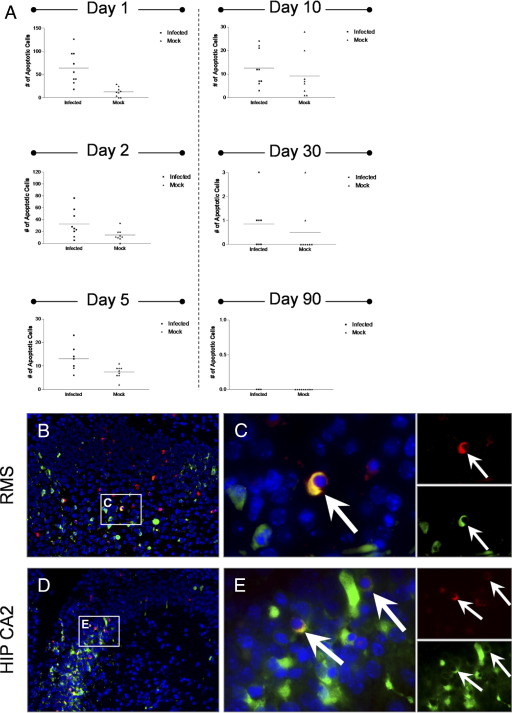
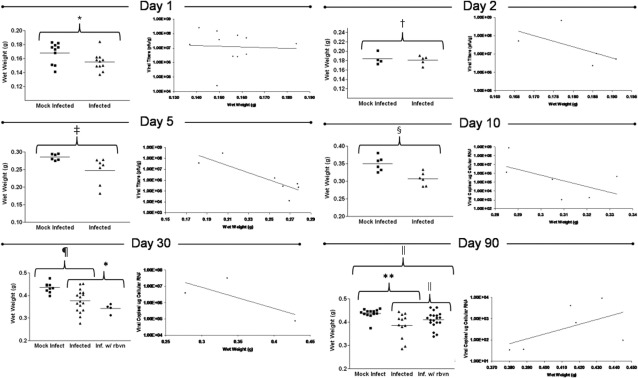
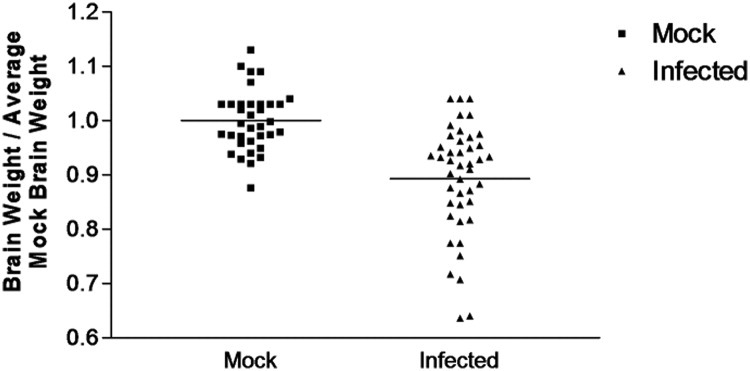
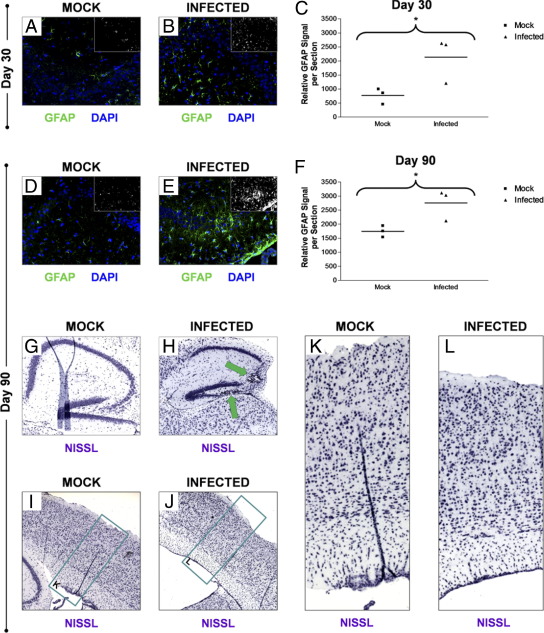
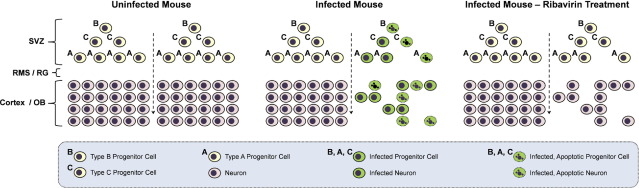
Coxsackieviruses are significant human pathogens causing myocarditis, meningitis, and encephalitis. We previously demonstrated the ability of coxsackievirus B3 (CVB3) to persist within the neonatal central nervous system (CNS) and to target neural stem cells. Given that CVB3 is a cytolytic virus and may therefore damage target cells, we characterized the potential reduction in neurogenesis within the developing brain and the subsequent developmental defects that occurred after the loss of these essential neural stem cells. Neonatal mice were inoculated with a recombinant CVB3 expressing eGFP (eGFP-CVB3), and alterations in neurogenesis and brain development were evaluated over time. We observed a reduction in proliferating cells in CNS neurogenic regions simultaneously with the presence of nestin(+) cells undergoing apoptosis. The size of the brain appeared smaller by histology, and a permanent decrease in brain wet weight was observed after eGFP-CVB3 infection. We also observed an inverse relationship between the amount of virus material and brain wet weight up to day 30 postinfection. In addition, signs of astrogliosis and a compaction of the cortical layers were observed at 90 days postinfection. Intriguingly, partial brain wet weight recovery was observed in mice treated with the antiviral drug ribavirin during the persistent stage of infection. Hence, long-term neurological sequelae might be expected after neonatal enteroviral infections, yet antiviral treatment initiated long after the end of acute infection might limit virus-mediated neuropathology.


Figures

Figure 1
Figure 1
Lethal inoculum of eGFP-CVB3 during the neonatal period hinders CNS development. One-day-old pups were infected with eGFP-CVB3 (2 × 10⁶ pfu i.c.) or were mock infected. Brains were harvested and fixed in 10% neutral buffered formalin at the indicated time points PI. Paraffin sections were stained by H&E or immunostained for the cellular proliferation antigen (Ki-67, red) and viral protein expression (GFP, green) and observed by fluorescence microscopy. A: Two color channels were merged into a single image (original magnification, ×5) and composites of overlapping fields were assembled to illustrate a complete transverse section of the neonatal CNS for two representative mice. Normal CNS development was observed in mock-infected pups. As would be expected for regions of neurogenesis in the CNS, a large number of Ki-67+ cells were observed in the SVZ near the lateral ventricles and in the cerebellum. In pups infected with eGFP-CVB3 and harvested 5 days later, the overall size of the brain was significantly smaller and the ventricles were severely distended. Furthermore, CNS lesions were seen in the hippocampus and cortex regions, in parallel with high levels of viral protein expression. The cerebellum (only partly visible) had little to no detectable viral protein levels and displayed similar numbers of proliferating (Ki-67+) cells compared with mock-infected control mice. Higher magnification for day 5 fluorescent images revealed that the number of proliferating (Ki-67+) cells was substantially reduced in the SVZ (white arrow) near the lateral ventricles, as compared with mock-infected control mice. B: High levels of Ki-67+ signal were observed in the SVZ of mock-infected mice. C: In contrast, the level of Ki-67+ signal was sharply reduced within infected mice. D: Quantification of Ki-67+ signal in the SVZ showed substantially reduced levels of staining in the SVZ of infected mice (*P = 0.0327). Quantification of Ki-67+ cells was done in triplicate (three mice per group and average of three fields per mouse) using ImageJ software as described previously.
Figure 2
Figure 2
High levels of apoptosis in neurogenic regions observed in both nestin+ and nestin- cells following a lethal inoculation with eGFP-CVB3. Pups 1 or 3 days old were infected with eGFP-CVB3 (2 × 10⁶ – 1 × 10⁷ pfu i.c.) or mock infected. Brain sections from pups harvested up to day 5 PI were examined for apoptotic activity by ApopTag staining. A: An increase in the level of apoptotic cells (red) was seen in the RMS of infected pups as compared with mock-infected mice. These apoptotic cells were identified as neuroblasts which migrate through the RMS by staining for neuronal β-tubulin (green). B: Little to no apoptotic cells were identified in mock-infected control mice. C: Clear apoptotic activity (red) was also observed in the SVZ as early as day 2 PI. The white dotted line represents the boundary between the ependymal cell layer and the lateral ventricle. D: Higher magnification revealed apoptotic cells located adjacent or within infected (GFP+) cells. E: By day 5 PI, high levels of apoptosis were observed near the lateral ventricles, the hippocampus, and regions of the cortex. These regions also supported high levels of viral protein expression. F: Higher magnification of the hippocampus demonstrated apoptosis in the dentate gyrus and in the CA3 region of Ammon's horn. G: In contrast, mock-infected control pups showed little or no apoptotic activity in the CNS. H–J: Using nestin (green) as a marker we identified neural stem and progenitor cells undergoing apoptosis within the SVZ. Immunofluorescence microscopy identified nestin+ cells in the SVZ undergoing apoptosis (red) at 24 (H), 36 (I), and 48 hours PI (J), (white arrows), respectively. K: More than 50% of cells undergoing apoptosis were identified as neural stem and progenitor cells by nestin staining. Also, the total number of apoptotic cells was significantly higher in infected mice, as compared with mock-infected mice (*P = 0.0042). For quantification, three mice were used per group and time point.
Figure 3
Figure 3
Viral titers over time in 3-day-old mice after a nonlethal inoculation with eGFP-CVB3. Pups 3 days old were infected with an amount of viral inoculum whereby mice survived infection (eGFP-CVB3 at 1 × 10⁷ pfu i.c.). Brains were harvested and virus titers in brain homogenates were determined by plaque assay. A: Early time points (days 1, 2, and 5) showed high viral titers for multiple animals. At later time points (days 10, 30, and 90), no detectable infectious virus was observed. B: In contrast, viral RNA was detected by real-time RT-PCR up to day 90 PI (three mice per time point) demonstrating the presence of viral genomic material for extended periods.
Figure 4
Figure 4
Surviving mice infected with eGFP-CVB3 showed higher levels of apoptosis in the SVZ up to 10 days PI, as compared with mock-infected mice. Three day-old pups were infected with eGFP-CVB3 (1 × 10⁷ pfu i.c.) or were mock infected. A: Levels of apoptosis were quantified in the SVZ for both infected and mock-infected mice by ApopTag staining. Higher levels of apoptosis were observed specifically within infected mice during acute time points (days 1, 2, and 5 PI). By day 90 PI, levels of ApopTag staining were below detection limits for both infected and mock-infected mice. B and D: Active caspase-3 (red) was detected by immunofluorescence microscopy within the hippocampus and in neurogenic regions at 36 hours PI. High levels of active caspase-3 were observed near sites of infection in the RMS (B) and in the CA2 region of the hippocampus (D; green). C and E: Higher magnification of (B) and (D), respectively, showed colocalization of active caspase-3 with cells expressing high levels of viral protein (white arrows). Single-channel images for active caspase-3 and viral protein demonstrated the overlapping red and green signal. Nuclei/DNA were stained with DAPI (blue).
Figure 5
Figure 5
Surviving mice infected with eGFP-CVB3 exhibited reduced brain wet weights at early and late time points, as compared with mock-infected mice. Pups 3 days old were infected with eGFP-CVB3 (1 × 10⁷ pfu i.c.) or mock infected and harvested up to day 90 PI. At time of harvest, brain wet weights for infected or mock-infected mice were determined. Infected mice showed a statistically significant reduction in brain wet weights on day 1 PI (*P = 0.0468), day 2 PI (P = 0.7162), day 5 PI (P = 0.0339), day 10 PI (§P = 0.037), day 30 PI (P < 0.05), and day 90 PI (P < 0.03). Also, an inverse relationship trend was observed between the brain wet weights of infected mice and viral RNA load up to day 30 PI (as determined by real time RT-PCR): the lower the brain wet weight, the higher the viral RNA load. Student's t-test was used to compare brain wet weights for infected and mock-infected animals. The antiviral drug ribavirin was injected i.p. into infected mice at late time points to determine whether viral replication during persistence contributed to the observed reduced brain wet weights. Different treatment regimens were used for day 30 (administered 2 weeks before harvest; treatment every 3 days) and day 90 (administered 30 days before harvest; treatment every 3 days). Although no significant change in brain wet weights was observed for day 30 ribavirin-treated infected mice, analysis of variance analysis with Newman–Keuls method revealed a significant increase (*P < 0.03) in brain wet weight for day 90 ribavirin-treated infected mice, as compared with untreated infected animals.
Figure 6
Figure 6
Surviving mice infected with eGFP-CVB3 from all time points showed reduced brain wet weights, as compared with averaged brain weights of mock-infected mice. Pups 3 days old were infected with eGFP-CVB3 (as described in Figure 5) or mock-infected. Brain wet weights from infected and mock-infected mice were normalized to average mock-infected brain wet weights for each time point. The normalized brain wet weight results for animals from all time points (days 1, 2, 5, 10, 30, and 90 PI) are graphically displayed. A highly significant difference was observed between infected and mock-infected brain wet weights when mice from all time points were compared (P < 0.0001; Student's t-test).
Figure 7
Figure 7
Astrogliosis and neurological abnormalities in mice surviving CVB3 infection. Pups 3 days old were infected with eGFP-CVB3 (1 × 10⁷ pfu i.c.) or mock-infected. Brains from days 30 and 90 PI were inspected for signs of lasting CNS defects and neuropathology., Astrogliosis in the hippocampus was quantified by GFAP immunofluorescence in both mock-infected (A) and infected (B) mice. Relatively higher levels of GFAP expression were observed within infected mice at 30 days PI, as compared with mock-infected control mice. C: Higher GFAP levels seen for infected mice 30 days PI were quantified by ImageJ analysis and the results were shown to be statistically significant (P = 0.0503). Compared with mock-infected mice (D), relatively higher levels of GFAP remained within the hippocampus of infected mice (E) as long as 90 days PI. F: GFAP levels in the hippocampus remained higher at 90 day PI, as quantified by ImageJ analysis (P = 0.0407). Compared with mock-infected mice (G), the overall size of the hippocampus within infected mice (H) appeared smaller 90 days PI by Nissl staining. Also, some infected mice exhibited lesions in the CA3 region of Ammon's horn and in the dentate gyrus (green arrows). Compared with mock-infected mice (I), the cortex of infected mice (J) also appeared to be smaller in width by Nissl staining. Compared with mock-infected mice (K), closer inspection of the cortex revealed the overall compaction of the cortical layers and reduced germinal cells in the SVZ layer of infected mice (L).
Figure 8
Figure 8
Model for coxsackievirus-induced depletion of progenitor cells and neurons in the CNS. The SVZ of noninfected mice (left column) contains three populations of neural stem and progenitor cells (NPSCs; type B, C, and A progenitor cells). Type B cells give rise to type C cells, which eventually produce migratory neuroblasts (type A cells). NPSCs migrate through the rostral migratory stream (RMS) or radial glia (RG) and differentiate into mature neurons in the olfactory bulb or cortex. In an infected mouse (center column), CVB3 infects neural NPSCs. Some infected NPSCs undergo apoptosis depleting the resident population of cells. Other infected NPSCs survive initial infection and migrate and differentiate into neurons within the CNS. The infected migratory cells assist in the dissemination of virus. Many infected neurons eventually undergo apoptosis. Apoptosis of NPSCs and neurons following CVB3 infection may lead to a reduction in neurons and neurodevelopmental defects. In an infected mouse treated with ribavirin (right column), ongoing sporadic viral replication during persistence may be reduced. After ribavirin treatment, progenitor cells and neurons may be protected from ongoing infection and apoptosis, thereby leading to partial brain wet-weight recovery in the mouse.

Similar articles

Cited by

References

    1. Berger J.R., Chumley W., Pittman T., Given C., Nuovo G. Persistent Coxsackie B encephalitis: report of a case and review of the literature. J Neurovirol. 2006;12:511–516. - PubMed
    1. Kamei S., Hersch S.M., Kurata T., Takei Y. Coxsackie B antigen in the central nervous system of a patient with fatal acute encephalitis: immunohistochemical studies of formalin-fixed paraffin-embedded tissue. Acta Neuropathol (Berl) 1990;80:216–221. - PubMed
    1. Whitton J.L., Cornell C.T., Feuer R. Host and virus determinants of picornavirus pathogenesis and tropism. Nat Rev Microbiol. 2005;3:765–776. - PubMed
    1. Romero J.R. Pediatric group B coxsackievirus infections. Curr Top Microbiol Immunol. 2008;323:223–239. - PubMed
    1. Wikswo M.E., Khetsuriani N., Fowlkes A.L., Zheng X., Penaranda S., Verma N., Shulman S.T., Sircar K., Robinson C.C., Schmidt T., Schnurr D., Oberste M.S. Increased activity of Coxsackievirus B1 strains associated with severe disease among young infants in the United States, 2007–2008. Clin Infect Dis. 2009;49:e44–e51. - PubMed

Publication types

MeSH terms

Substances