. 2012 Jan 3:3:608.
doi: 10.1038/ncomms1611.

Muscle-derived stem/progenitor cell dysfunction limits healthspan and lifespan in a murine progeria model

Affiliations
Free PMC article

Muscle-derived stem/progenitor cell dysfunction limits healthspan and lifespan in a murine progeria model

Mitra Lavasani et al. Nat Commun. .
Free PMC article

Abstract

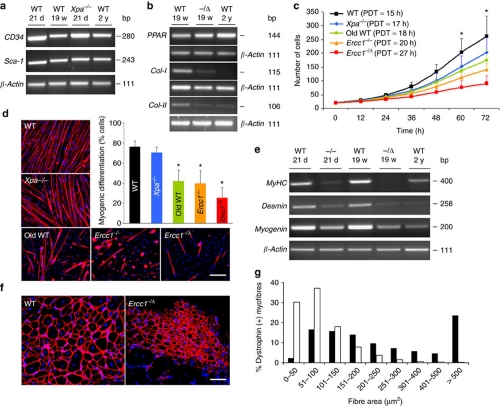
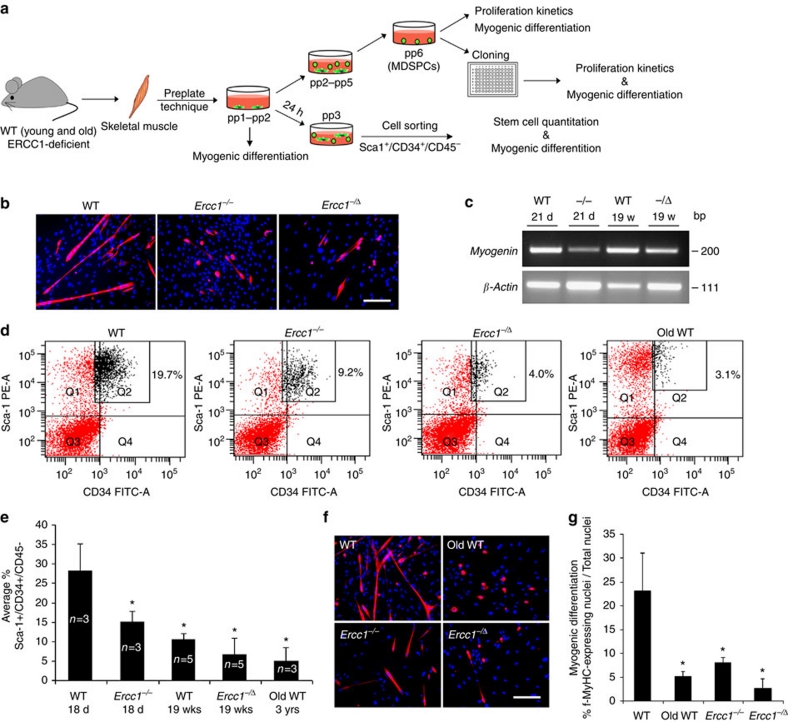
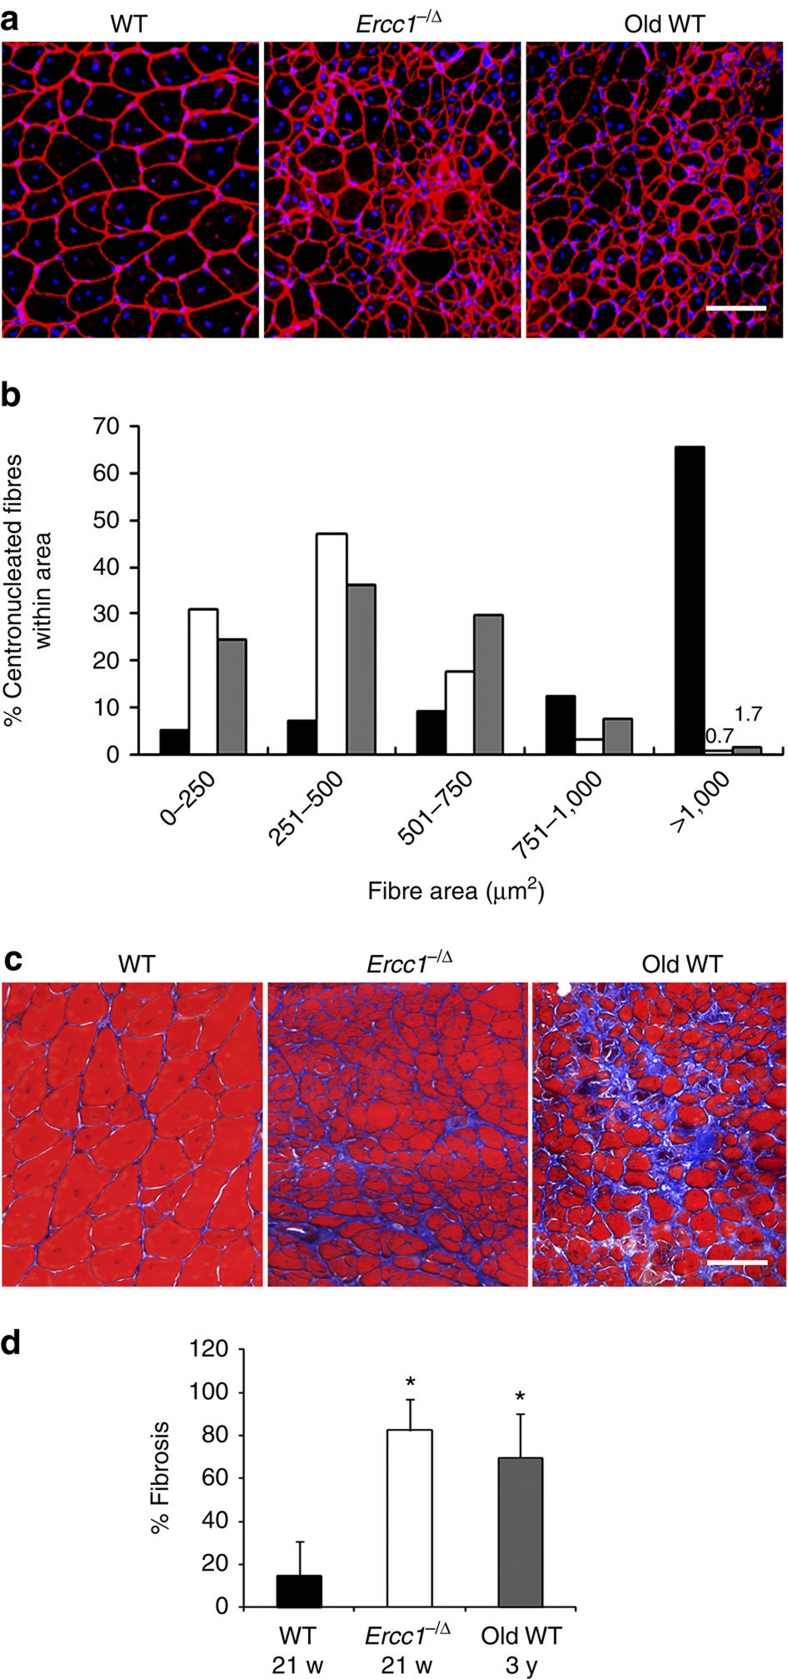
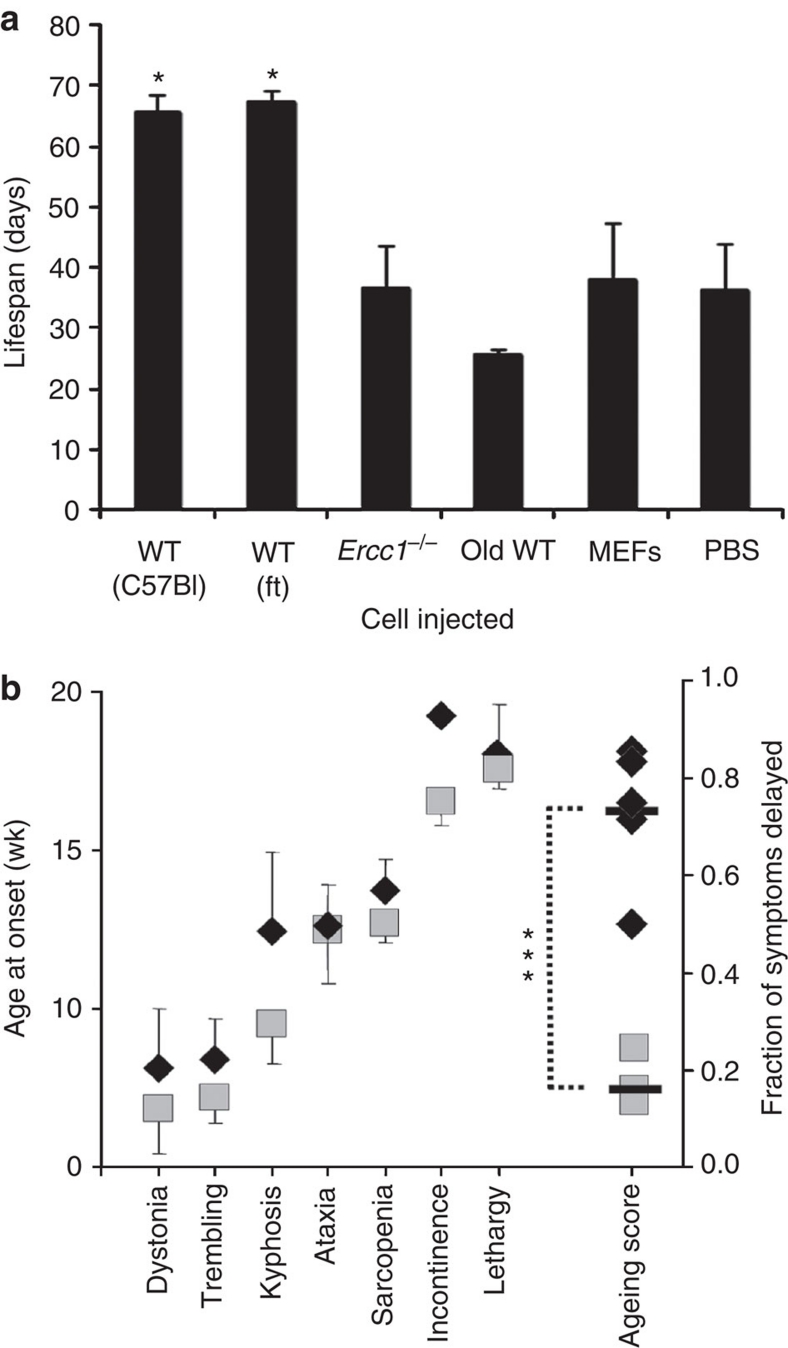
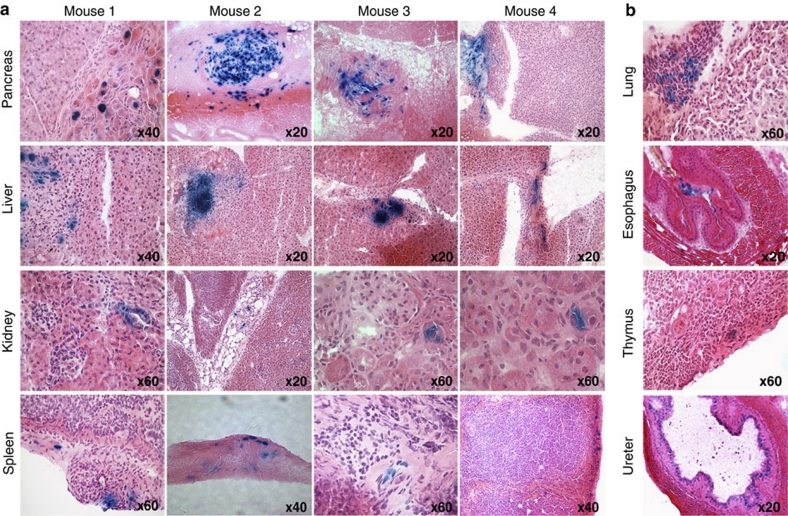
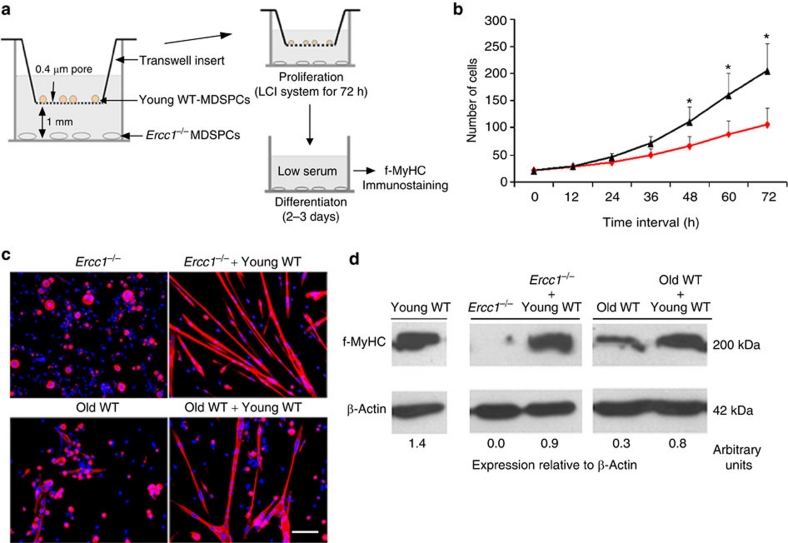
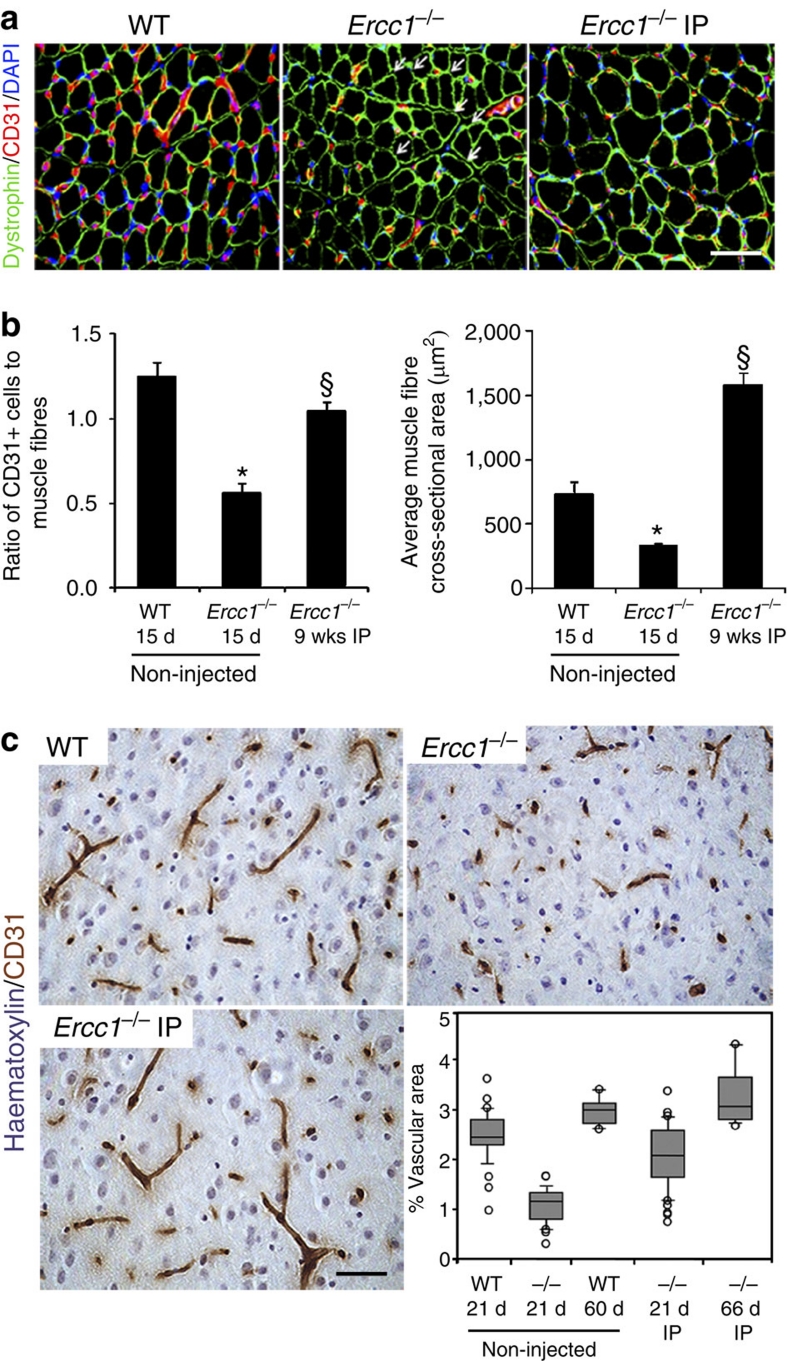
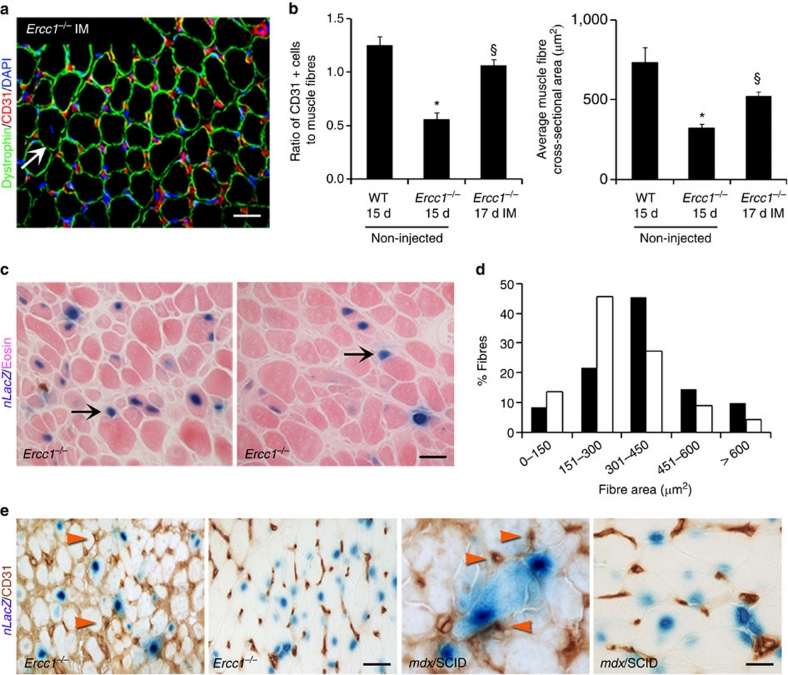
With ageing, there is a loss of adult stem cell function. However, there is no direct evidence that this has a causal role in ageing-related decline. We tested this using muscle-derived stem/progenitor cells (MDSPCs) in a murine progeria model. Here we show that MDSPCs from old and progeroid mice are defective in proliferation and multilineage differentiation. Intraperitoneal administration of MDSPCs, isolated from young wild-type mice, to progeroid mice confer significant lifespan and healthspan extension. The transplanted MDSPCs improve degenerative changes and vascularization in tissues where donor cells are not detected, suggesting that their therapeutic effect may be mediated by secreted factor(s). Indeed, young wild-type-MDSPCs rescue proliferation and differentiation defects of aged MDSPCs when co-cultured. These results establish that adult stem/progenitor cell dysfunction contributes to ageing-related degeneration and suggests a therapeutic potential of post-natal stem cells to extend health.


Conflict of interest statement

The authors, except J.H., declare no competing financial interests. J.H. receives consulting fees from Cook MyoSite.

Figures

Figure 1
Figure 1. Measuring MDSPC proliferation, differentiation, and regenerative potential.
(a) rtPCR to measure stem/progenitor cell markers CD34 and Sca-1 in MDSPCs isolated from muscle of mice at various ages. Shown is a representative image from analysis of 3–4 independent MDSPC populations per genotype/age at passage 23–25. (b) rtPCR to measure differentiation markers. Peroxisome proliferator-activated receptor (PPAR) is an adipocyte marker; collagen 1 (Col-1) is an osteocyte marker; collagen-2 (Col-2) is a chondrocyte marker. β-Actin was the loading control. Shown is a representative image from analysis of three independent MDSPC populations of each genotype/age. (c) Proliferation of MDSPCs measured by live-cell imaging. Plotted are the average number of cells at each time point calculated from 3–4 populations per genotype ±s.d. (*P<0.05, Tukey's test). Average PDT was calculated from analysis of 40 images per time point. (d) Representative images of in vitro myogenic differentiation. Cells were immunostained for the terminal differentiation marker, f-MyHC (red). Scale bar=100 μm. Quantification of myogenic differentiation was calculated as the fraction of cells (DAPI, blue) expressing f-MyHC (red) from 3–4 cell populations per genotype ±s.d; *P<0.001 relative to young WT-MDSPCs (black bar), Kruskal–Wallis ANOVA on ranks. (e) rtPCR to measure expression of the terminal differentiation markers, MyHC, desmin, and myogenin, after myogenic differentiation of MDSPCs isolated from mice of various genotypes/ages. Shown is a representative image from 3 MDSPC populations tested per group. (f) Representative image of gastrocnemius muscle sections from dystrophic mice 14 days post-injection of WT or Ercc1−/Δ MDSPCs to test myogenic differentiation in vivo. The sections were immunostained for dystrophin (red) to identify myofibres from donor cells. Scale bar=100 μm. (g) Quantification of the donor myofibre area in dystrophic mice transplanted with WT-MDSPCs (black bars) or MDSPCs from Ercc1−/Δ mice (white bars). Plotted is the average number of myofibres of each size range calculated from >2,000 fibres analysed per mdx/SCID mouse (n=8) treated with 2 independent MDSPC populations per genotype. (P<0.001, for all distribution ranges except 101–150; Mann–Whitney rank sum test).
Figure 2
Figure 2. Measuring the number of MDSPCs isolated from murine muscle and their myogenic potential.
(a) A schematic diagram showing the early passage cells analysed in this figure and the method used to isolate various populations of MDSPCs (pp1–pp6). (b) Representative images of pp1–pp2 cells induced to undergo myogenic differentiation. Cells directly isolated from skeletal muscle of mice, using preplate technique (pp1–pp2), were incubated in fusion media to induce myogenic differentiation. Twenty-four hours post-isolation, adhering cells were trypsinized and plated at equal density and induced to undergo myogenic differentiation over 2–3 days. Cells from 2–3 independent populations of each genotype were immunostained for the terminal myogenic differentiation marker, f-MyHC (red). Scale bar=100 μm. (c) rtPCR to measure the expression of the myogenic differentiation marker, myogenin in pp1–pp2 cells, induced to undergo myogenic differentiation. (d) Quantification of Sca-1+/CD34+/CD45 cells in young WT-, old WT-, and progeroid- (Ercc1−/−, Ercc1−/Δ) murine skeletal muscle. Twenty-four hours after isolation from muscle, the cells that did not adhere in preplate 1 and 2 (that is, pp3) were analysed for stem/progenitor cell markers by FACS. The number in the upper right quadrants indicates the percent of Sca-1+/CD34+/CD45 cells isolated from 3–5 mice of each genotype/age. (e) Graph indicating the average fraction of Sca-1+/CD34+/CD45 cells normalized to the weight of the cell pellet of pp3 cell populations. Error bars indicate ±s.d. *P<0.05, Tukey's test, relative to young WT cells. (f) Representative images of Sca-1+/CD34+/CD45 -sorted cells plated at equal density and induced to undergo myogenic differentiation. The cells were stained for the terminal myogenic marker, f-MyHC (red). Scale bar=100 μm. (g) Quantification of myogenic differentiation of Sca-1+/CD34+/CD45 cells isolated from the skeletal muscle of mice of various genotypes/ages measured as the percent of cells (DAPI, blue) expressing f-MyHC (red). Error bars indicate ±s.d. for cell populations isolated from 2–3 animals per genotype *P<0.001, Kruskal–Wallis ANOVA on ranks relative to young WT cells.
Figure 3
Figure 3. Measuring muscle regeneration after injury in old and progeroid mice.
To measure muscle stem/progenitor cell function in vivo, cardiotoxin was injected directly into the gastrocnemius muscle of old WT (3-yr-old; n=3), adult WT (18–21-wk-old; n=5), and progeroid Ercc1−/Δ (21-wk-old; n=2 plus 8-wk-old; n=3) mice to induce muscle injury. Two wks later, tissues were collected and stained for dystrophin (red) and nuclei (DAPI). (a) Representative images of damaged muscle sections. Scale bar=100 μm. (b) Quantification of the cross-sectional area of regenerating myofibres after muscle injury of adult WT mice (black bars), progeroid Ercc1−/Δ littermates (white bars) and old WT mice (grey bars). The area of >1,000 myofibres was measured per group of mice. The distribution of fibre size is indicated on the x-axis, representing increasingly more mature fibres with increased size. The fraction of regenerating, centronucleated myofibres of each size range is plotted. (P<0.001, Kruskal–Wallis ANOVA on ranks at 0–250, 251–500, and >1,000). (c) Trichrome staining of sections from the same damaged muscles to reveal areas of fibrosis (blue). Shown are representative images from 1 of 2–3 mice of each genotype analysed. (d) Histogram indicating the area of fibrotic scarring following cardiotoxin injection. Plotted is the average fraction (n=2–3 animals per genotype/age) of the area examined that is fibrotic in percent ±s.d. *P<0.05, Tukey's test, relative to young WT. Scale bar=100 μm.
Figure 4
Figure 4. Measuring the impact of MDSPC transplantation on the lifespan and healthspan of progeroid mice.
(a) 2–4×10⁵ MDSPCs per gram body weight were injected into the peritoneal cavity of 17-day-old Ercc1−/− mice and lifespan measured. The median lifespan of Ercc1−/− mice is 21 days; the maximum is 28 days. The lifespan of Ercc1−/− mice injected with two independent MDSPC populations isolated from young WT mice were compared with Ercc1−/− mice injected with vehicle only (PBS), an equivalent number of WT MEFs, or MDSPCs isolated from old WT or progeroid Ercc1−/− mice. Reported is the average lifespan from 4–10 mice injected per treatment group. Error bars indicate s.e.m. *P<0.05, Dunn's test comparing the WT groups with all other treatment groups. A summary of the cell lines injected and number of animals transplanted can be found in Supplementary Table S3. (b) 2–4 ×10⁵ MDSPCs per gram body weight were injected into the peritoneal cavity of 7-wk-old Ercc1−/Δ mice and again at 13 wks of age. The age at onset of the characteristic, spontaneous, ageing-related symptoms seen in Ercc1−/Δ mice was measured (MDSPC-treated mice, black diamonds) and compared with mice injected with vehicle only (PBS; grey squares). Reported is the average age at onset of each progeroid symptom in wks ±s.d. (n=8 mice per treatment group). The ageing score is calculated as the fraction of symptoms that were delayed in a single Ercc1−/Δ mice injected with young WT-MDSPCs compared with an age- and sex-matched mouse (usually a littermate) injected with PBS (Supplementary Methods). The black bars denote the average ageing score for each group (***P<0.0008, Student's t-test).
Figure 5
Figure 5. Determination of the site for donor cell engraftment of young WT-MDSPCs.
2–4 ×10⁵ young WT-MDSPCs expressing nuclear LacZ per gram body weight were injected IP into Ercc1−/− mice to determine the sites of engraftment. Mice were injected at 12 days of age and euthanized 8–9 days later (n=4) or injected at 17–19 days of age and tissues collected at the end of their lifespan (4–9-wks of age; n=4). Fourteen organs/tissues were isolated, sectioned and stained with X-gal to identify donor cells (Supplementary Table S4). (a) Donor cells (LacZ+ stained blue) were detected in the pancreas, liver, spleen, and kidney of all host animals. Shown are representative images from four mice illustrating the site and extent of engraftment of donor cells. (b) Donor cells were detected in the lung, esophagus, thymus and ureter of at least one mouse. Shown are images at multiple levels of magnification from tissue sections of one mouse per organ to illustrate the site and extent of engraftment. The level of magnification is indicated for each tissue section image.
Figure 6
Figure 6. Measurement of proliferation and myogenic differentiation of MDSPCs co-cultured with young WT-MDSPCs.
(a) A schematic diagram of the co-culture system used to evaluate the effect of young functional MDSPCs on dysfunctional MDSPCs isolated from progeroid or old WT mice. Ercc1−/− MDSPCs were plated in the lower compartment of the transwell system in proliferation media. WT-MDSPCs were seeded onto the upper transwell membrane inserts, at the same density, and in the same media. These co-cultures were placed in the LCI system for 72 h to acquire time-lapsed images to measure proliferation of the MDSPCs. As a control, each plate contained wells of Ercc1−/− MDSPCs without transwell membrane inserts. (b) Plotted is the average cell number at each time point calculated from the analysis of three independent populations of Ercc1−/− MDSPCs co-cultured with young WT-MDSPCs (black line), or without (red line) ±s.d. *P<0.001, Mann–Whitney rank sum test. (c) The transwell inserts were removed after 72 h and the proliferation media was switched to differentiation media. After 2–3 days, myogenic differentiation of Ercc1−/− and old WT-MDSPC was tested by immunostaining the cells for f-MyHC (red). Shown are representative images. The nuclear counterstain is DAPI (blue). Scale bar=100 μm. (d) Quantification of myogenic differentiation of old WT-MDSPCs after growth in media conditioned from young WT-MDSPCs. Young WT-MDSPCs were cultured for 2 days in proliferation media in collagen-coated flasks, then treated with differentiation media for 3 days. The supernatant from these cultures was collected for use as conditioned media. MDSPCs from 21-day-old progeroid Ercc1−/− mice and 2-yr-old WT mice were grown in the presence of this conditioned media or unconditioned differentiation media to determine the impact on myogenic differentiation as measured by immunoblot detection of f-MyHC. Densitometric quantification of f-MyHC corrected for β-Actin is indicated below each lane.
Figure 7
Figure 7. Host muscle fibre size and tissue vascularization following intraperitoneal transplantation of young WT-MDSPCs.
(a) Representative sections from the gastrocnemius muscle of 15-day-old WT and Ercc1−/− mice, as well as Ercc1−/− mice transplanted with young WT-MDSPCs at 17 days of age and allowed to live their full lifespan (Ercc1−/− IP), immunostained for dystrophin (green), CD31 (red), and DAPI (blue). Arrows indicate myofibres lacking adjacent CD31+ cells (microvasculature). Scale bars=100 μm. (b) Quantification of microvasculature and myofibre size in these mice. Images from 4–8 sections and 500–1,000 fibres from 3 animals per group were analysed. Reported are the ratio of CD31+ cells to dystrophin-positive muscle fibres (left) and the average muscle fibre size (cross-sectional area; right). Error bars indicate s.e.m. *P<0.001, Student's t-test comparing the Ercc1−/− mice with WT mice and §P<0.05, Tukey's test comparing untreated and treated Ercc1−/− mice; for myofibre size *P=0.002, Mann–Whitney rank sum test comparing the Ercc1−/− mice with WT mice and §P<0.05, Dunn's Method comparing untreated and treated Ercc1−/− mice. (c) Representative images from sections of the cerebral cortex of 21-day-old WT and Ercc1−/− mice, and Ercc1−/− mice transplanted with young WT-MDSPCs. Tissue sections were stained for CD31 to detect the microvasculature. The percent of the tissue area representing vasculature was quantified using bright field images and Northern Eclipse software. Each circle plotted represents an individual mouse. The horizontal bar is the median (50th percentile) area. The box represents the 25th–75th percentile, and the error bars represent the 10th–90th percentile.
Figure 8
Figure 8. Measurement of host muscle fibre size and tissue vascularization after intramuscular transplantation with young WT-MDSPCs.
(a) The gastrocnemius muscle of 12-day-old Ercc1−/− mice (n=3 mice) was injected with young WT-MDSPCs. Tissues were isolated 5 days later (17 d) and sections were immunostained for dystrophin (green), CD31 (red), and DAPI (blue) and compared with untreated 15-day-old WT and Ercc1−/− mice (from Fig. 7). The white arrow denotes a centronucleated fibre. Scale bar=100 μm. (b) Quantification of microvasculature and myofibre size in transplanted and untreated mice. Images from 4–8 sections from 3 animals per group were analysed. Reported is the ratio of CD31+ cells to dystrophin-positive muscle fibres (left), §P<0.05 between untreated and treated Ercc1−/− mice, Tukey's test. On the right is the average muscle fibre size (cross-sectional area), §P<0.05 between untreated and treated Ercc1−/− mice, Dunn's test. Error bars indicate s.e.m. (c) Seventeen day-old progeroid Ercc1−/− mice (n=10) were injected IM with WT-MDSPCs expressing nuclear LacZ to determine whether donor cells integrate into muscle fibres and contribute to blood vessels. Five days later, the mice were euthanized and the gastrocnemius muscles were isolated for analysis. Muscle sections at the injection site were stained with X-gal, to detect donor cells, and eosin. Scale bar=50 μm. (d) Histogram of the cross-sectional area distribution of myofibres in the treated gastrocnemius muscles (black bars) compared the contralateral non-injected muscle (white bars). Data were collected from 6,000 fibres from multiple sections of four mice per group. The distribution of fibre size is indicated on the x-axis, representing increasingly more mature fibres with increased size (P<0.001, Mann–Whitney rank sum test at 151–300 and 301–450). (e) Sections from the injected muscles stained for CD31 to identify blood vessels (dark brown) and X-gal to identify donor cells (blue). Red arrowheads indicate CD31+ capillary structures. Sections from dystrophic (mdx/SCID) mice treated the same way are included as a positive control (right panels). Scale bars=50 μm.

References

    1. Kirkwood T. B. Understanding the odd science of aging. Cell 120, 437–447 (2005). - PubMed
    1. Sharpless N. E. & DePinho R. A. How stem cells age and why this makes us grow old. Nat. Rev. Mol. Cell Biol. 8, 703–713 (2007). - PubMed
    1. Rossi D. J., Jamieson C. H. & Weissman I. L. Stems cells and the pathways to aging and cancer. Cell 132, 681–696 (2008). - PubMed
    1. Molofsky A. V. et al.. Increasing p16INK4a expression decreases forebrain progenitors and neurogenesis during ageing. Nature 443, 448–452 (2006). - PMC - PubMed
    1. Kuhn H. G., Dickinson-Anson H. & Gage F. H. Neurogenesis in the dentate gyrus of the adult rat: age-related decrease of neuronal progenitor proliferation. J. Neurosci. 16, 2027–2033 (1996). - PMC - PubMed

Publication types

MeSH terms