. 2012 May-Jun;32(3):292-304.
doi: 10.3747/pdi.2010.00315. Epub 2012 Jan 3.

Influence of bicarbonate/low-GDP peritoneal dialysis fluid (BicaVera) on in vitro and ex vivo epithelial-to-mesenchymal transition of mesothelial cells

Affiliations

Influence of bicarbonate/low-GDP peritoneal dialysis fluid (BicaVera) on in vitro and ex vivo epithelial-to-mesenchymal transition of mesothelial cells

Antonio Fernández-Perpén et al. Perit Dial Int. 2012 May-Jun.

Abstract

Background: Peritoneal membrane damage induced by peritoneal dialysis (PD) is largely associated with epithelial-to-mesenchymal transition (EMT) of mesothelial cells (MCs), which is believed to be a result mainly of the glucose degradation products (GDPs) present in PD solutions.

Objectives: This study investigated the impact of bicarbonate-buffered, low-GDP PD solution (BicaVera: Fresenius Medical Care, Bad Homburg, Germany) on EMT of MCs in vitro and ex vivo.

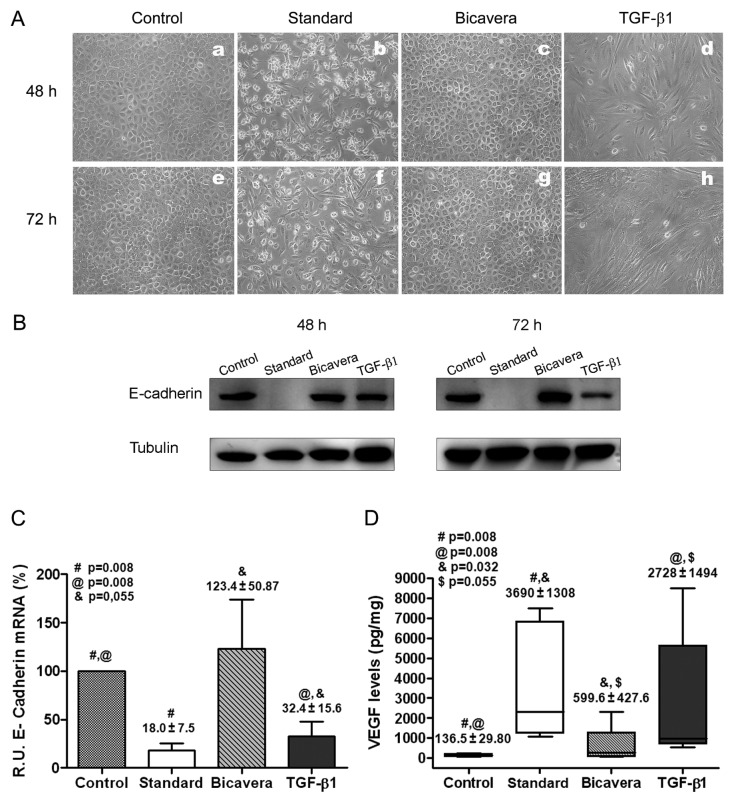
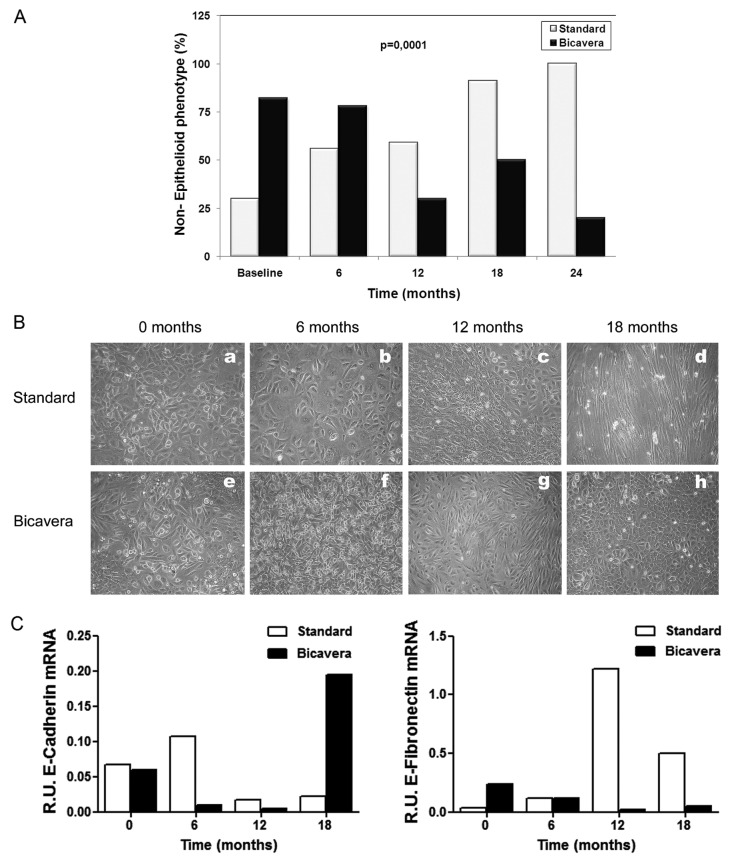
In vitro studies: Omentum-derived MCs were incubated with lactate-buffered standard PD fluid or BicaVera fluid diluted 1:1 with culture medium. Ex vivo studies: From 31 patients randomly distributed to either standard or BicaVera solution and followed for 24 months, effluents were collected every 6 months for determination of EMT markers in effluent MCs.

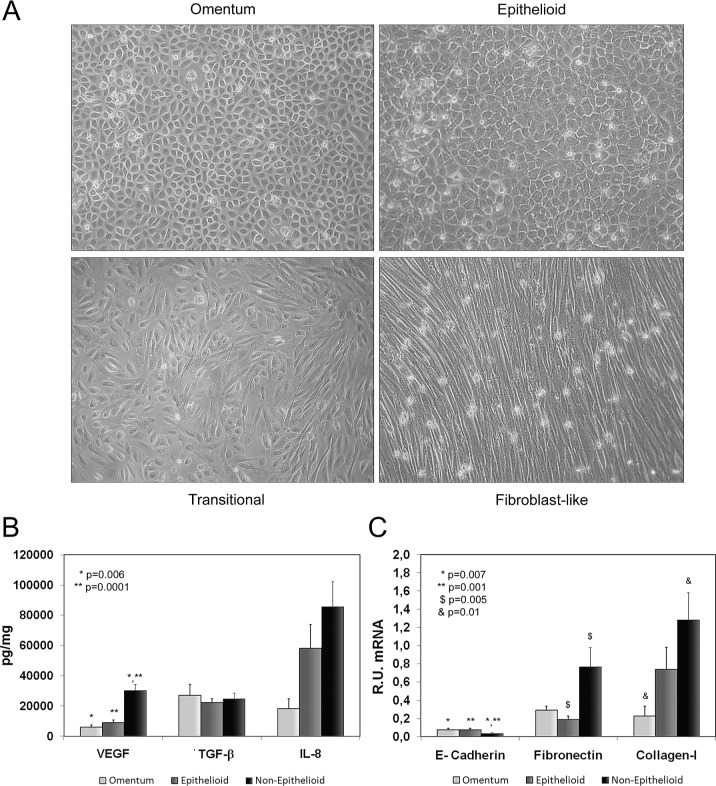
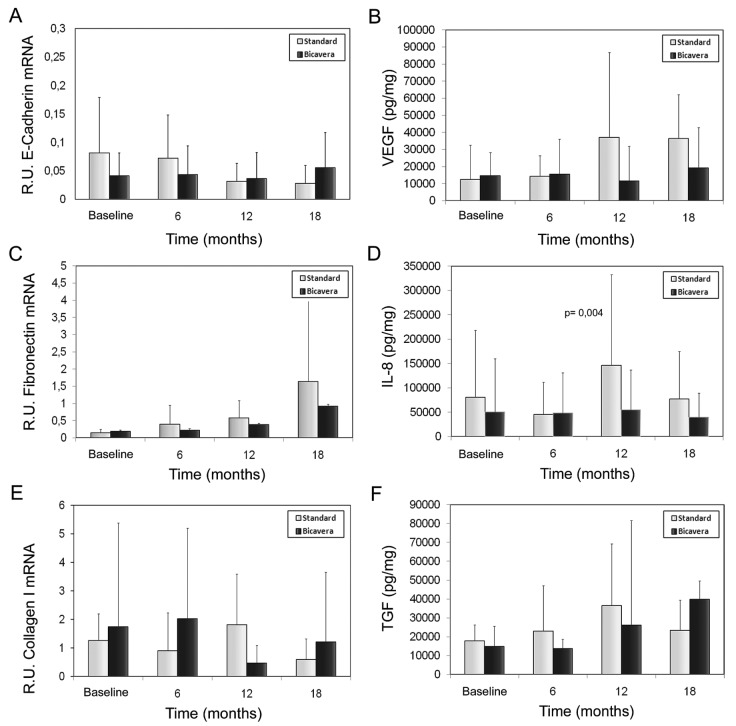
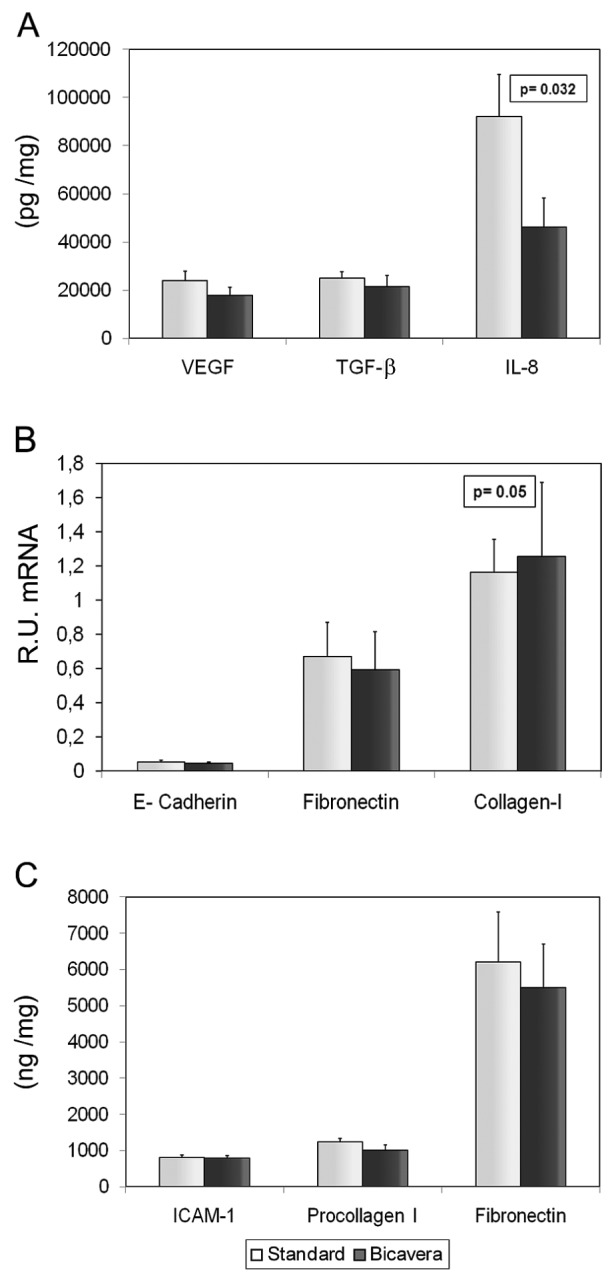
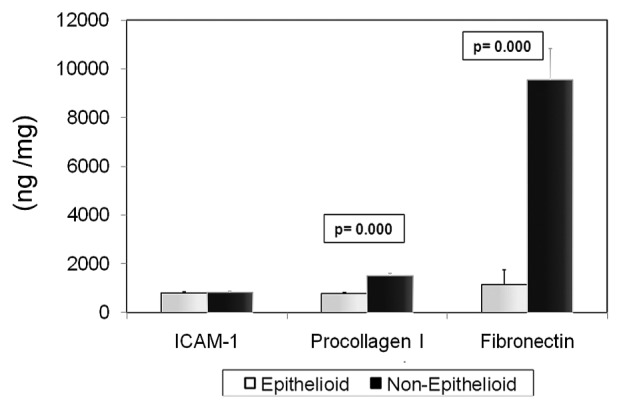
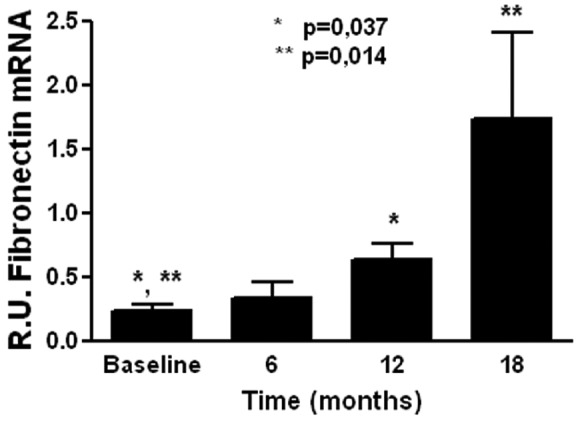
Results: Culturing of MCs with standard fluid in vitro resulted in morphology change to a non-epithelioid shape, with downregulation of E-cadherin (indicative of EMT) and strong induction of vascular endothelial growth factor (VEGF) expression. By contrast, in vitro exposure of MCs to bicarbonate/low-GDP solution had less impact on both EMT parameters. Ex vivo studies partially confirmed the foregoing results. The BicaVera group, with a higher prevalence of the non-epithelioid MC phenotype at baseline (for unknown reasons), showed a clear and significant trend to gain and maintain an epithelioid phenotype at medium- and longer-term and to show fewer fibrogenic characteristics. By contrast, the standard solution group demonstrated a progressive and significantly higher presence of the non-epithelioid phenotype. Compared with effluent MCs having an epithelioid phenotype, MCs with non-epithelioid morphology showed significantly lower levels of E-cadherin and greater levels of fibronectin and VEGF. In comparing the BicaVera and standard solution groups, MCs from the standard solution group showed significantly higher secretion of interleukin 8 and lower secretion of collagen I, but no differences in the levels of other EMT-associated molecules, including fibronectin, VEGF, E-cadherin, and transforming growth factor β1. Peritonitis incidence was similar in both groups. Functionally, the use of BicaVera fluid was associated with higher transport of small molecules and lower ultrafiltration capacity.

Conclusions: Effluent MCs grown ex vivo from patients treated with bicarbonate/low-GDP BicaVera fluid showed a trend to acquire an epithelial phenotype, with lower production of proinflammatory cytokines and chemokines (such as interleukin 8) than was seen with MCs from patients treated with a lactate-buffered standard PD solution.


Figures

Figure 1
Figure 1
— Characterization of effluent-derived mesothelial cells (MCs). (A) Omentum-derived and the three possible morphologies (epithelial-like, transitional, fibroblast-like) of effluent-derived confluent MCs. Because of similarity in their markers of epithelial–mesenchymal transition (EMT), we grouped transitional and fibroblast-like MCs into a single category: non-epithelioid MCs. (B) Expression levels of EMT markers in supernatants: in non-epithelioid MCs, levels of vascular endothelial growth factor (VEGF) and interleukin 8 (IL-8) were seen to be increased [p = 0.0001 and 0.089 (not shown) respectively], but levels of transforming growth factor β1 (TGF-β1) were not. (C) In non-epithelioid (compared with omentum-derived) MCs, we found a significant downregulation of E-cadherin (p = 0.001) messenger RNA (mRNA) expression and an important upregulation of fibronectin (p = 0.005) and collagen I (p = 0.01) mRNA expression. R.U. = relative units.
Figure 2
Figure 2
— Effects of peritoneal dialysis (PD) fluids on mesothelial cells (MCs) in vitro. (A) Effects on MC morphology at 48 and 72 hours. Images are representative of 5 independent experiments. (B) Western blot results show expression of E-cadherin in exposed MCs. Tubulin was used as a loading control. Images are representative of 5 independent experiments. (C) Levels of E-cadherin messenger RNA (mRNA) analyzed by quantitative reverse transcription polymerase chain reaction [for MCs treated with PD fluids or with transforming growth factor β1 (TGF-β1) relative to untreated cells]. Results are mean ± standard error of 5 experiments. (D) Production of vascular endothelial growth factor (VEGF) in supernatant (picograms per milligram of cell protein) by omentum-derived MCs treated with PD fluids or with TGF-β1. The box plots show 75th percentile, 25th percentile, median, maximum, and minimum values from 5 experiments. BicaVera: solution from Fresenius Medical Care, Bad Homburg, Germany. R.U. = relative units.
Figure 3
Figure 3
— Epithelioid and non-epithelioid mesothelial cell (MC) phenotypes in the standard fluid and BicaVera (Fresenius Medical Care, Bad Homburg, Germany) study groups. (A) Differences in the percentage of non-epithelioid MC phenotypes in the groups over time (mixed model, fluid–time: p = 0.0001). (B,C) Representative images from 2 patients (a – d = standard fluid; e – h = BicaVera) showing acquisition of non-epithelioid MC morphology and increased expression of fibronectin with standard fluid and preservation of epithelioid MC morphology and increased expression of E-cadherin with BicaVera fluid at 18 months of follow-up. R.U. = relative units.
Figure 4
Figure 4
— Bar plots of cytokine levels in supernatant or extract from mesothelial cells (MCs) derived from effluents in the BicaVera (Fresenius Medical Care, Bad Homburg, Germany) and standard fluid (Stay·Safe: Fresenius Medical Care) groups. The statistical comparison uses mixed-model analysis, which determines the significance of differences between the groups and for each group over time. No significant differences were observed for (A) levels of E-cadherin messenger RNA (mRNA) in MCs (relative units); (B) production of vascular endothelial growth factor (VEGF, picograms per milligram) in supernatant; (C) levels of fibronectin mRNA in MCs (relative units); (E) levels of collagen I mRNA in MCs (relative units); and (F) levels of transforming growth factor β1 (TGF-β1, picograms per milligram) in supernatant. Significantly higher levels were observed only for (D) supernatant levels of interleukin 8 (IL-8, picograms per milligram) in the standard fluid group, which showed a significant trend to rise over time (fluid–time: p < 0.01). R.U. = relative units.
Figure 5
Figure 5
— Mean values of the various mesothelial cell products in culture for the study groups (all samples). We observed (A) significantly higher levels of interleukin 8 (IL-8, picograms per milligram) in supernatant in the standard fluid group; (A,B) similar levels of vascular endothelial growth factor (VEGF), transforming growth factor β1 (TGF-β1), E-cadherin, fibronectin, and collagen I in both groups; and (C) no significant differences in protein levels (nanograms per milligram) of intracellular adhesion molecule 1 (ICAM-1), procollagen I, and fibronectin in MC lysate. BicaVera: solution from Fresenius Medical Care, Bad Homburg, Germany. R.U. = relative units.
Figure 6
Figure 6
— In a comparison of cellular lysates by mesothelial cell phenotype, protein levels (nanogram per milligram) of procollagen and fibronectin were observed to be higher (p = 0.0001) for the non-epithelioid phenotype; levels of intracellular adhesion molecule 1 (ICAM-1) were observed to be similar for all phenotypes.
Figure 7
Figure 7
— Expression levels of fibronectin messenger RNA (mRNA) in non-epithelioid mesothelial cells (MCs) from the BicaVera (Fresenius Medical Care, Bad Homburg, Germany) group. Non-epithelioid MCs appear to be associated with levels of fibronectin mRNA that, compared with baseline, are higher at later periods. R.U. = relative units.

References

    1. Grassmann A, Gioberge S, Moeller S, Brown G. ESRD patients in 2004: global overview of patients numbers, treatment modalities and associated trends. Nephrol Dial Transplant 2005; 20:2587–93 - PubMed
    1. Krediet RT, Zweers MM, van der Wal AC, Struijk DG. Neoangiogenesis in the peritoneal membrane. Perit Dial Int 2000; 20(Suppl 2):S19–25 - PubMed
    1. Krediet RT, Lindholm B, Rippe B. Pathophysiology of peritoneal membrane failure. Perit Dial Int 2000; 20(Suppl 4):S22–42 - PubMed
    1. Jiménez–Heffernan JA, Perna C, Auxiliadora Bajo M, Luz Picazo M, Del Peso G, Aroeira L, et al. Tissue distribution of hyalinizing vasculopathy lesions in peritoneal dialysis patients: an autopsy study. Pathol Res Pract 2008; 204:563–7 - PubMed
    1. Margetts PJ, Bonniaud P. Basic mechanisms and clinical implications of peritoneal fibrosis. Perit Dial Int 2003; 23:530–41 - PubMed

Publication types