. 2012 Feb 24;287(9):6387-405.
doi: 10.1074/jbc.M111.288167. Epub 2012 Jan 3.

Insights into role of bromodomain, testis-specific (Brdt) in acetylated histone H4-dependent chromatin remodeling in mammalian spermiogenesis

Affiliations

Insights into role of bromodomain, testis-specific (Brdt) in acetylated histone H4-dependent chromatin remodeling in mammalian spermiogenesis

Surbhi Dhar et al. J Biol Chem. .

Abstract

Mammalian spermiogenesis is of considerable biological interest especially due to the unique chromatin remodeling events that take place during spermatid maturation. Here, we have studied the expression of chromatin remodeling factors in different spermatogenic stages and narrowed it down to bromodomain, testis-specific (Brdt) as a key molecule participating in chromatin remodeling during rat spermiogenesis. Our immunocytochemistry experiments reveal that Brdt colocalizes with acetylated H4 in elongating spermatids. Remodeling assays showed an acetylation-dependent but ATP-independent chromatin reorganization property of Brdt in haploid round spermatids. Furthermore, Brdt interacts with Smarce1, a member of the SWI/SNF family. We have studied the genomic organization of smarce1 and identified that it has two splice variants expressed during spermatogenesis. The N terminus of Brdt is involved in the recognition of Smarce1 as well as in the reorganization of hyperacetylated round spermatid chromatin. Interestingly, the interaction between Smarce1 and Brdt increases dramatically upon histone hyperacetylation both in vitro and in vivo. Thus, our results indicate this interaction to be a vital step in the chromatin remodeling process during mammalian spermiogenesis.


Figures

FIGURE 1.
FIGURE 1.
Expression analysis of chromatin remodeling factors in different stages of spermatogenesis. A, semi-quantitative RT-PCR analysis of remodeling factors. Tetraploid and haploid germ cells were isolated by centrifugal elutriation. Testicular cells from a 10-day-old rat represent the gametic diploid cell population. Expression of 30 chromatin remodeling factors was compared among three stages of spermatogenesis, vis à vis gametic diploid (GD), tetraploid (T), and haploid (H). The genes that are expressed in haploid spermatids are highlighted with *. B, real time RT-PCR analysis of remodeling factors expressing in haploid spermatids. Thirteen remodeling factors were picked for a more quantitative analysis of mRNA expression based on the semi-quantitative RT-PCR data. Fold change in expression for each remodeling factor was compared between gametic diploid, tetraploid, and haploid germ cell stages taking gametic diploid as the reference. NACA1 was used as the normalization control.
FIGURE 2.
FIGURE 2.
Brdt is present from early to late stages of spermiogenesis and colocalizes with acetylated H4. A, ×40 immunofluorescence image using mouse polyclonal antibody against Brdt showed its presence in different stages of spermiogenesis. Columns from left to right show fluorescence patterns of DAPI, Brdt, and Merge (DAPI/Brdt). Yellow arrows represent round spermatids; white arrows represent different steps of elongating spermatids. No signal was detected with PIS. Scale bars, 20 μm. B, nuclear extracts from testes of a 60-day-old rat (T) and liver (L) were immunoblotted with the Brdt antibody. A band at ∼120 kDa appeared specifically in the testicular extract but not liver. rBrdt was used as a positive control. No such reaction was observed with PIS. A Coomassie Blue-stained gel serves as the loading control. C, localization of Brd2 was mapped in spermiogenesis using goat polyclonal antibody (Abcam). Columns from left to right show fluorescence patterns of DAPI, Brd2, and Merge (DAPI/Brd2). In all panels, yellow arrows represent round spermatids; red arrows, early elongating spermatids; blue arrows, mid-elongating spermatids, and green arrows, late elongating spermatids. Scale bars, 5 μm. D, zoomed ×40 image represents the status of colocalization between acetylated H4 (red) and Brdt (green) in different spermatogenic cells. In all panels, yellow arrows represent round spermatids; red arrows, early elongating spermatids; blue arrows, mid-elongating spermatids, and green arrows, late elongating spermatids. Scale bar, 10 μm. E, representative ×100 images of spermatogenic cells showing the pattern of colocalization between acetylated H4 (red) and Brdt (green). RS represents round spermatid; EES represents early elongating spermatid; MES represents mid-elongating spermatid, and LES represents late elongating spermatid. Scale bars, 5 μm. F, analysis of colocalization between acetylated H4 and Brdt. Panels I–IV represent the scatter plot analysis and cut mask images for round spermatid, early elongating spermatid, mid-elongating spermatid and late elongating spermatid cells from E. The third quadrant in the scatter plot represents the colocalized pixels which are depicted (as white pixels) within the cut mask images. G, table summarizing the average percentage of colocalization between acetylated H4 and Brdt in different cell types. Data were obtained by performing colocalization analysis on a representative cell from 3 to 5 rounds of immunolocalization experiments. The values remained unchanged even upon switching the fluorophores (i.e. acetylated H4 (green) and Brdt (red)).
FIGURE 3.
FIGURE 3.
In vitro remodeling by Brdt in RAG cells. A, Coomassie-stained image of a 12% SDS-polyacrylamide gel showing recombinant His-tagged Brdt protein, purified from a baculovirus expression vector system. B, treated and untreated cells were immunostained with α-acetylated lysine antibody to assess the increase in overall acetylation of RAG cells upon treatment with HDAC inhibitor. Columns from left to right show fluorescence patterns of acetyl-lysine, DAPI, and Merge (DAPI/Acetyl-lysine) for untreated (top panel) and treated (bottom panel) RAG cells. Scale bar, 10 μm. C, comparison of changes in chromatin as observed by DAPI staining upon performing in vitro remodeling assay. ×100 and corresponding zoom-in images show nuclei isolated from treated and untreated cells with rBrdt or without rBrdt. Scale bar, 10 μm.
FIGURE 4.
FIGURE 4.
In vitro remodeling by Brdt in haploid round spermatids. A, in vitro remodeling assay in haploid round spermatids. Round spermatids in culture were treated with HDAC inhibitors. Nuclei were isolated from untreated and treated cells and incubated with or without recombinant full-length Brdt protein, in the presence of exogenous ATP or upon depletion of endogenous ATP by apyrase. Chromatin reorganization in the nuclei was judged by DAPI staining. Two representative nuclei are shown for each reaction of treated versus untreated cells. The experiment was repeated three times. For each experiment, 20 nuclei per reaction were imaged at ×100 and analyzed for changes in chromatin organization. B, immunostaining with α-Brdt antibody (mouse) shows the presence of Brdt within the nuclei of both untreated and treated round spermatids. C, Brdt was unable to hydrolyze ATP as compared with apyrase (Ap), as analyzed by the ATPase assay. This activity did not appear even with increasing concentrations of Brdt in the presence of DNA or Unac or hyperacetylated (Ac) oligonucleosomes. Reactions containing only buffer (B) or DNA or unacetylated/acetylated oligonucleosomes served as negative controls. D, Brdt does not possess any ATPase activity despite the presence of a Walker-like motif in its C terminus, analyzed by the ClustalW software, aligning the consensus Walker motif sequence (GXXXXGKT) with the C terminus of Brdt.
FIGURE 5.
FIGURE 5.
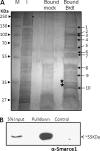
Smarce1, an interacting partner of Brdt in rat testes. A, immuno-pulldown of rBrdt and its associated interacting proteins. rBrdt was incubated with total testicular nuclear extracts from 55- to 60-day-old rat and immunoprecipitated using mouse polyclonal α-Brdt antibody (lane Bound Brdt). Rabbit IgG was used for mock pulldown (lane- Bound Mock). Lane I represents 20% of the total testicular nuclear extract used for pulldown with rBrdt. Samples were run on 12% SDS-PAGE, silver-stained, and analyzed by mass spectrometry. Arrows indicate the proteins identified by mass spectrometry (summarized in Table 1). Bands that are highlighted (*) could not be identified. Lane M, marker lane. B, Brdt and Smarce1 interaction was confirmed by Western blot analysis using α-Smarce1 antibody after rBrdt immuno-pulldown from testicular nuclear extracts. Pulldown with rabbit IgG served as control.
FIGURE 6.
FIGURE 6.
Expression analysis of Smarce1. A, semi-quantitative RT-PCR was performed using primers designed to specifically check the expression of smarce1 splice variants in different stages of spermatogenesis, i.e. gametic diploid (GD), tetraploid (T), and round spermatids (RS). Nascent polypeptide-associated complex α was used as a housekeeping control. B, Western blotting revealed the status of protein expression across spermatogenesis in 20-day-old rat testes (20d), 55-day-old rat testes (55d), round spermatids (RS), and sonication-resistant spermatids (SRS) nuclear extracts. Two variants of Smarce1 were observed at ∼55 kDa, and another band was seen below 35 kDa. Lower panel represents the nuclear extracts of 20-day-old rat testis (20d), 55-day-old rat testes (55d), round spermatids (RS), and sonication-resistant spermatids (SRS) on a Coomassie Blue-stained gel as loading control. C, a ×40 image represents the status of colocalization between Smarce1 (red) and Brdt (green) in different spermatogenic cells. Yellow arrows represent round spermatids; white arrows represent different steps of elongating spermatids. Scale bar, 20 μm. D, representative ×100 images of spermatogenic cells showing the pattern of colocalization between Smarce1 (red) and Brdt (green). RS represents round spermatid; EES represents early elongating spermatid; MES represents mid-elongating spermatid, and LES represents late elongating spermatid. Scale bars, 5 μm. E, analysis of colocalization between Smarce1 and Brdt. Panels I–IV represent the scatter plot analysis and cut mask images for round spermatid, early elongating spermatid, mid-elongating spermatid, and late elongating spermatid cells from D. The third quadrant in the scatter plot represents the colocalized pixels which are depicted (as white pixels) within the cut mask images. F, table summarizing the average percentage of colocalization between Smarce1 and Brdt in different cell types. Data were obtained by performing colocalization analysis on a representative cell from 3 to 5 rounds of immunolocalization experiments. The values remained unchanged even upon switching the fluorophores (i.e. Smarce1 (green) and Brdt (red)).
FIGURE 7.
FIGURE 7.
Splice variants of Smarce1. A, genomic organization of smarce1 gene on human chromosome 17, mouse chromosome 11, and rat chromosome 10 is shown. The information on the rat chromosome 10 was not fully available, hence the human and mouse smarce1 genomic organization was used as reference. The black boxes represent the exons, and the white boxes represent the introns. The region including the fourth exon, which is spliced to give rise to the smaller variant, is highlighted in the gray box. The 105-bp sequence of the fourth exon and start of intron boundaries (blue) is depicted. B, sequence of the smarce1 splice variants. The bands at 1.13 kb (smaller variant) and 1.236 kb (larger variant) shown in Fig. 6C were sequenced. The 105-bp additional sequence in the larger variant (shown here in red) exactly matches the sequence of the fourth exon.
FIGURE 8.
FIGURE 8.
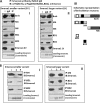
Brdt interacts with Smarce1 through its N terminus in vitro. A, in vitro immunoprecipitation (IP) experiments were performed using Smarce1 antibody and mock rabbit IgG (IgG) as control. I is the input lane representing 20% of the protein sample added to the reaction. Experiments were performed in parallel for Smarce1 smaller variant (panel I) and larger variant (panel II). Brdt was detected by α-His antibody. Immunoblotting (IB) with α-FLAG antibody was used to detect partial constructs of Brdt- M4 (N terminus), M6 (C terminus), BD1 (first bromodomain), and BD2 (second bromodomain). Smarce1 pulldown was probed with α-Smarce1 antibody, and a Coomassie Blue-stained gel of Smarce1 indicates equal loading. Panel III shows the schematic domain architecture of Brdt and its deletion mutants. B, reverse FLAG-tag pulldown. Panels I and II show reactions performed for Smarce1 smaller variant and larger variant, respectively. Brdt mutants M4, BD1, and BD2 were immunoprecipitated using FLAG M2-agarose beads, and immunoblotting was done using α-Smarce1 antibody. In each case, the deletion mutants were probed with α-FLAG antibody to confirm the pulldown (data not shown). Coomassie Blue-stained gel of Smarce1 depicts equal loading. I, 20% input protein; C, pulldown of Smarce1 with only beads as control; P, pulldown of Smarce1 with Brdt mutants.
FIGURE 9.
FIGURE 9.
A dose-dependent increase in interaction of Smarce1 with Brdt in the presence of acetylated H4. An in vitro experiment was performed to check the effect of acetylated H4 on interaction between Smarce1 and Brdt. The concentrations of M4 (Brdt N terminus) and Smarce1 were kept constant, whereas the concentration of acetylated H4 was increased from 0.5 to 3 μg (lanes 1–4). An increase in the Smarce1 pulldown by M4 is observed upon increasing acetylated H4 concentration. No such enhanced interaction is observed upon increasing unacetylated H4 concentration (lanes 6–9). Lane 5 represents interaction between Smarce1 and M4 (without H4). A dose-dependent increase in the pulldown of acetylated H4 is seen in lanes 1–4, but no corresponding bands are seen for unacetylated H4 (lanes 6–9). A Ponceau stained image of M4 depicts equal loading. M, marker; I, input (50%).
FIGURE 10.
FIGURE 10.
N terminus of Brdt (M4) recruits endogenous Smarce1 to acetylated chromatin in round spermatids. A and B show treated and untreated round spermatid nuclei, respectively. In each case, panel I shows changes in chromatin reorganization (visualized by DAPI) brought about by M4. Although the nuclei of untreated cells remained unaltered upon M4 addition, chromatin of treated nuclei showed reorganization. Panel II depicts the colocalization of endogenous Smarce1 with FLAG-M4. Columns from left to right show fluorescent signals obtained from Smarce1, FLAG-M4, and Merge (DAPI/Smarce1/FLAG-M4). It was observed that the colocalization of Smarce1 with M4 increased upon hyperacetylation of the chromatin. The scatter plot is shown in panel III, in which Smarce1 and FLAG-M4 colocalized pixels are represented in quadrant 3. Panel IV represents the cut mask image of nuclei (from panel II) showing only colocalized pixels. C, data of Smarce1 and FLAG-M4 colocalization from three independent experiments are plotted in a graph, showing the percentage of colocalized pixels increases upon treatment of round spermatids with HDAC inhibitors (NaBu and TSA). D, pulldown experiments were performed on nuclei following remodeling assay. An increased pulldown of Smarce1, acetylated H4 (AcH4), and β-actin was observed in the nuclei of treated round spermatids compared with untreated nuclei. M4 represents equal pulldown in treated and untreated nuclei. Input NE represents 20% of the nuclear extracts. Tubulin and GAPDH were used as negative controls for the pulldown reactions.
FIGURE 11.
FIGURE 11.
Model proposing the mechanism of chromatin remodeling in spermiogenesis. A, chromatin is represented at the dinucleosome level, where histone H4 in one nucleosome interacts with H2A-H2B dimer of the neighboring nucleosome by H-bonds and salt bridges. B, wave of H4-hyperacetylation begins in the early elongating spermatids, acetylating H4 at lysines 5, 8, 12, and 16. This mark is recognized by a double bromodomain containing protein, Brdt, via its first bromodomain. C, Brdt reorganizes the acetylated chromatin and further recruits Smarce1 and other interacting proteins (e.g. β-actin). D, finally the histones are removed from the chromatin and replaced by transition proteins (TP) (10% of histones are retained).

References

    1. Kornberg R. D. (1974) Chromatin structure. A repeating unit of histones and DNA. Science 184, 868–871 - PubMed
    1. Luger K., Mäder A. W., Richmond R. K., Sargent D. F., Richmond T. J. (1997) Crystal structure of the nucleosome core particle at 2.8 Å resolution. Nature 389, 251–260 - PubMed
    1. Peterson C. L., Laniel M. A. (2004) Histones and histone modifications. Curr. Biol. 14, R546–R551 - PubMed
    1. Shahbazian M. D., Grunstein M. (2007) Functions of site-specific histone acetylation and deacetylation. Annu. Rev. Biochem. 76, 75–100 - PubMed
    1. Jenuwein T., Allis C. D. (2001) Translating the histone code. Science 293, 1074–1080 - PubMed

Publication types

MeSH terms