. 2012 Mar;80(3):1232-42.
doi: 10.1128/IAI.06138-11. Epub 2012 Jan 3.

Analysis of global transcriptional profiles of enterotoxigenic Escherichia coli isolate E24377A

Affiliations

Analysis of global transcriptional profiles of enterotoxigenic Escherichia coli isolate E24377A

Jason W Sahl et al. Infect Immun. 2012 Mar.

Abstract

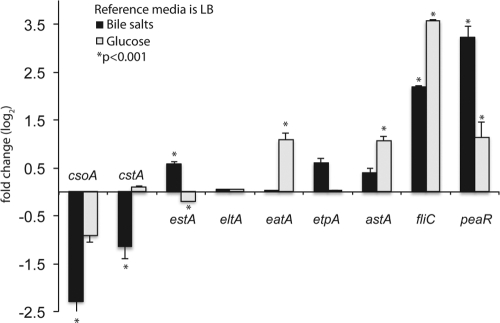
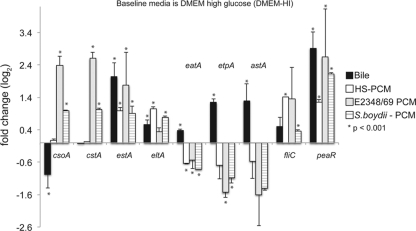
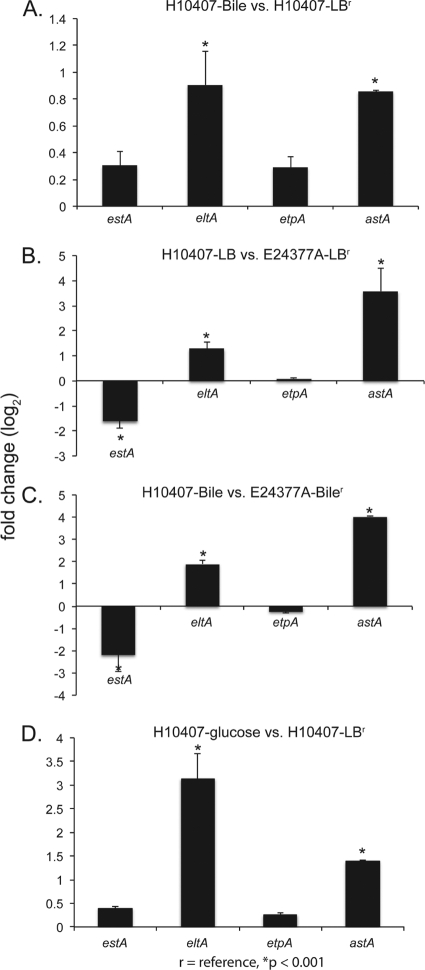
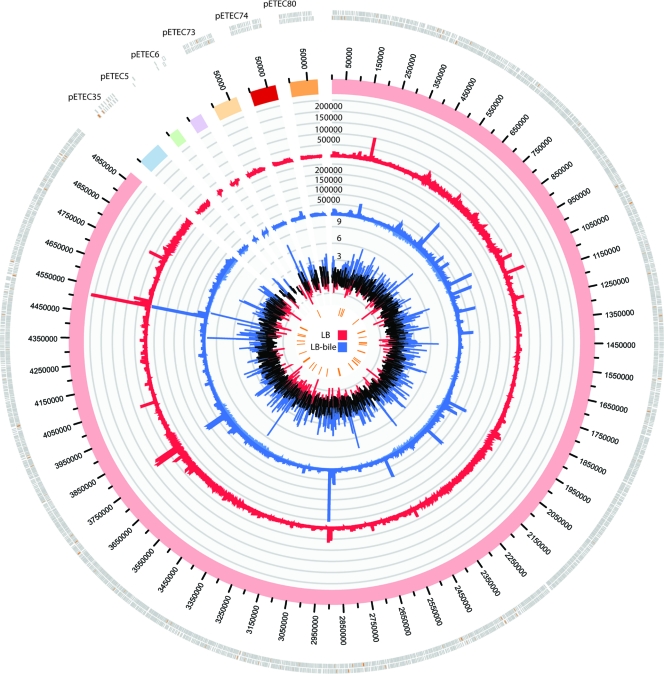
Enterotoxigenic Escherichia coli (ETEC) is an important pathogenic variant (pathovar) of E. coli in developing countries from a human health perspective, causing significant morbidity and mortality. Previous studies have examined specific regulatory networks in ETEC, although little is known about the global effects of inter- and intrakingdom signaling on the expression of virulence and colonization factors in ETEC. In this study, an E. coli/Shigella pan-genome microarray, combined with quantitative reverse transcriptase PCR (qRT-PCR) and RNA sequencing (RNA-seq), was used to quantify the expression of ETEC virulence and colonization factors. Biologically relevant chemical signals were combined with ETEC isolate E24377A during growth in either Luria broth (LB) or Dulbecco's modified Eagle medium (DMEM), and transcription was examined during different phases of the growth cycle; chemical signals examined included glucose, bile salts, and preconditioned media from E. coli/Shigella isolates. The results demonstrate that the presence of bile salts, which are found in the intestine and thought to be bactericidal, upregulates the expression of many ETEC virulence factors, including heat-stable (estA) and heat-labile (eltA) enterotoxin genes. In contrast, the ETEC colonization factors CS1 and CS3 were downregulated in the presence of bile, consistent with findings in studies of other enteric pathogens. RNA-seq analysis demonstrated that one of the most differentially expressed genes in the presence of bile is a unique plasmid-encoded AraC-like transcriptional regulator (peaR); other previously unknown genetic elements were found as well. These results provide transcriptional targets and putative mechanisms that should help improve understanding of the global regulatory networks and virulence expression in this important human pathogen.


Figures

Fig 1
Fig 1
Effect of the addition of glucose or bile to LB media. A column chart of fold changes of expression values (qRT-PCR) between ETEC E24377A grown in bile salts and grown in glucose to an OD600 of 0.5 is shown. Values are based on fold change calculated from ΔΔCT values. All values are log2 transformed. Columns with an asterisk indicate a significant P value of <0.001 as calculated by Student's t test. Error bars represent standard deviations of the results determined with 2 biological replicates. The reference is E24377A grown in LB alone to an OD600 of 0.5. Variable patterns of gene expression were observed with the selected virulence factors.
Fig 2
Fig 2
E. coli E24377A gene expression profiles in response to biologically relevant environmental signals A column chart showing fold change expression values (qRT-PCR) between ETEC E24377A grown in DMEM media and biologically relevant additives: bile (3% [wt/vol]; black bars), preconditioned media from commensal E. coli isolate HS (white bars), enteropathogenic E. coli isolate E2348/69 (gray bars), and Shigella boydii BS512 (horizontally striped bars). Values are based on fold change calculated from ΔΔCT values. All values are log2 transformed. Columns with an asterisk indicate a significant P value of <0.001 as calculated by Student's t test. Error bars represent standard deviations of the results determined with at least 2 biological replicates. The reference is E24377A grown in DMEM alone to an OD600 of 0.5. PCM, preconditioned media. The responses differed among the various preconditioned media, indicating a species-specific response, whereas the bile response was similar to that observed with LB media as described for Fig. 1.
Fig 3
Fig 3
Identification of transcriptional differences between prototype ETEC strains. To determine the impact of strain on the transcriptional response in ETEC isolates E24377A and H10407, we used qRT-PCR to examine 4 genes. Columns with an asterisk indicate a significant P value of <0.001 as calculated by Student's t test. Error bars represent standard deviations of the results determined with at least 2 biological replicates. (A) Differential expression between H10407 grown in LB and in LB-bile, demonstrating significantly increased expression of eltA and astA. (B) H10407 expression in LB compared to E24377A expression in LB, with significantly increased expression of eltA and astA. (C) Differential expression between H10407 and E24377A grown in LB-bile, demonstrating a significantly greater bile-related response of the eltA and astA genes in H10407. (D) Differential expression of H10407 grown in either LB or LB-glucose. This panel highlights the previously published response of H10407 to glucose, which differs significantly from that in E24377A (Fig. 1).
Fig 4
Fig 4
Temporal expression of ETEC virulence factors in bile. A time course column chart of E24377A grown in LB-bile to different growth densities (OD600 = 0.2, 0.5, and 0.8) is shown. Values are based on fold change calculated from ΔΔCT values. Columns with an asterisk indicate a significant P value of <0.001 as calculated by Student's t test. Error bars indicate standard deviations of the results determined with biological replicates. Overall, we observed generally increased gene expression as the cultures reached the stationary phase of growth, suggesting that a quorum-sensing mechanism is involved in global ETEC regulation.
Fig 5
Fig 5
Global transcriptional analysis as determined by RNA-seq and circular visualization. A circular plot showing the RNA-seq mapping data for E24377A chromosome and its 6 plasmids is shown. The outer histogram, colored red, represents the normalized mapped reads from E24377A grown in LB. The blue histogram represents the normalized mapped reads from E24377A grown in LB-bile. The inner histogram shows all fold changes for each annotated genomic feature. Peaks tipped in blue represent upregulation in LB-bile (log2 fold change > 2), while those tipped in red represent downregulation in LB-bile (log2 fold change < −2). The inner data track ticks (orange) include those features that showed significant differential regulation (P < 0.08) according to DESeq.

Similar articles

Cited by

References

    1. Anders S, Huber W. 2010. Differential expression analysis for sequence count data. Genome Biol. 11:R106. - PMC - PubMed
    1. Benjamini Y, Hochberg Y. 1995. Controlling the false discovery rate: a practical and powerful approach to multiple testing. J. R. Stat. Soc. Series B Stat. Methodol. 57:289–300
    1. Bodero MD, Harden EA, Munson GP. 2008. Transcriptional regulation of subclass 5b fimbriae. BMC Microbiol. 8:180. - PMC - PubMed
    1. Bodero MD, Munson GP. 2009. Cyclic AMP receptor protein-dependent repression of heat-labile enterotoxin. Infect. Immun. 77:791–798 - PMC - PubMed
    1. Crane JK, Choudhari SS, Naeher TM, Duffey ME. 2006. Mutual enhancement of virulence by enterotoxigenic and enteropathogenic Escherichia coli. Infect. Immun. 74:1505–1515 - PMC - PubMed

Publication types

MeSH terms

Associated data