Review
. 2012 Jan 1;26(1):11-24.
doi: 10.1101/gad.179804.111.

A decade of 3C technologies: insights into nuclear organization

Affiliations
Review

A decade of 3C technologies: insights into nuclear organization

Elzo de Wit et al. Genes Dev. .

Abstract

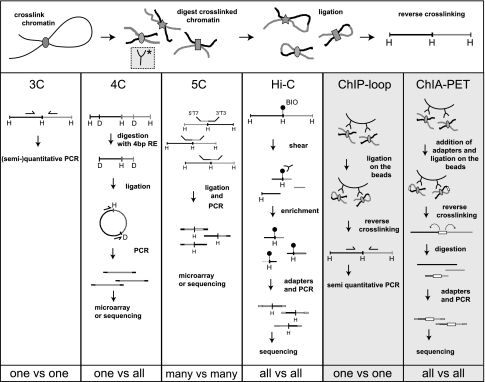
Over the past 10 years, the development of chromosome conformation capture (3C) technology and the subsequent genomic variants thereof have enabled the analysis of nuclear organization at an unprecedented resolution and throughput. The technology relies on the original and, in hindsight, remarkably simple idea that digestion and religation of fixed chromatin in cells, followed by the quantification of ligation junctions, allows for the determination of DNA contact frequencies and insight into chromosome topology. Here we evaluate and compare the current 3C-based methods (including 4C [chromosome conformation capture-on-chip], 5C [chromosome conformation capture carbon copy], HiC, and ChIA-PET), summarize their contribution to our current understanding of genome structure, and discuss how shape influences genome function.


Figures

Figure 1.
Figure 1.
Overview of 3C-derived methods. An overview of the 3C-derived methods that are discussed is given. The horizontal panel shows the cross-linking, digestion, and ligation steps common to all of the “C” methods. The vertical panels indicate the steps that are specific to separate methods.
Figure 2.
Figure 2.
3C data and the ACH. (A) Example of 3C data showing enhancer looping at the mouse β-globin locus (reproduced from Tolhuis et al. [2002] with permission from Elsevier, © 2002). The relative cross-linking frequency (Y-axis) is plotted for the β-major gene (the anchor point; thick black vertical line) with selected other restriction fragments (gray vertical lines) across the locus. The organization of the locus is shown at the top, with arrows pointing at regulatory sequences, the LCR being comprised of regulatory sequence 1–6, and the β-globin genes shown as triangles. In fetal livers (red line), where β-major is active and under the control of the LCR, loops are found between the gene and the LCR. In fetal brains (blue line), where the gene is silent, no such loops are observed. (B) Based on various 3C experiments in the β-globin locus, the ACH model was proposed. A schematic representation shows the conformation of the locus in its active conformation. Used with permission from Splinter and de Laat (2011).
Figure 3.
Figure 3.
4C-seq example data and analysis. (A) In 4C-seq, ligation junctions (or “captures”) of a given genomic site (“viewpoint” or “bait”) are PCR-amplified using viewpoint-specific primers. Because the 4C primers also contain the Illumina sequencing primers, the PCR products can be sequenced without further processing. The reads contain the primer and the ligation junction. After trimming the primer sequence, the remainder of the reads are aligned to the genome. (B) A chromosomal map displays the raw 4C-seq counts of the mouse Rad23a locus in neural precursor cells. The 4C profile shows the characteristic peak flanking the viewpoint. (C) With windowed approaches such as running mean or median, a low-pass filter is applied to the data, allowing a view of chromosomal interactions mostly free of noise. (D) Ultimately, high-level analyses, such as domainograms for visualization or false discovery rate (FDR)-based methods for identifying statistically significant interactions, can be employed (Splinter et al. 2011). Domainograms are multiscale representations for the enrichment of 4C captures in a given region. Lightly colored areas show genomic regions that are significantly enriched for 4C captures. An FDR-based method can be employed to identify regions that are significantly enriched. The magenta arcs show the interactions with the viewpoint across the chromosome.
Figure 4.
Figure 4.
5C and HiC offer matrices of interaction frequencies. (A) 5C results across 500 kb around the inactive and active α-globin locus (in GM12878 and K562 cells, respectively) (top) are modeled to show that the active locus adopts a more open conformation, whereas in the inactive state, the locus shows a closed conformation (bottom). Used with permission from Macmillan Publishers Ltd. (from Bau et al. 2011) (© 2011). (B) Based on HiC data, chromosome-wide matrices of interaction frequencies can be plotted. A contact map with 1-Mb resolution (with a step size of 100 kb) of human chromosome 14 is shown. The middle panel shows the plaid-like pattern, which is the ultimate result of the HiC analysis method. The right panel shows a fractal globule, a model for human chromosome organization that was postulated based on HiC data (Lieberman-Aiden et al. 2009) and theoretical analysis (Grosberg and et al. 1993). Plots are based on data from Gene Expression Omnibus entry GSE18199 (Lieberman-Aiden et al. 2009).
Figure 5.
Figure 5.
ChIA-PET offers insight into the chromosome interactome for the CTCF protein. (A) Results of three ChIA-PET libraries for the insulator protein CTCF. Paired-end tags show possible interactions between two protein-binding sites. Arcs highlight loops formed between genomic sites. (B) Schematic representation of a possible model for the folding of the locus shown in A.
Figure 6.
Figure 6.
Different levels at which methods that probe the 1D and 3D genome operate. (A) A length scale shows the resolution of the data that are obtained with various genome-wide methods. This is important for comparisons made between various data sets. (B) Graph representation of possible models of genome organization; circles identify loci in the genome, and colors represent different chromatin states. The microenvironment model describes strong separation between genomic regions that have different chromatin states, but assumes few preferences in contacts between genomic regions with similar chromatin. In the network model, on the other hand, such preferences do exist, and interactions between similarly typed chromatin regions can be mutually exclusive.

References

    1. Al-Shahrour F, Diaz-Uriarte R, Dopazo J 2004. FatiGO: A Web tool for finding significant associations of gene ontology terms with groups of genes. Bioinformatics 20: 578–580 - PubMed
    1. Bantignies F, Roure V, Comet I, Leblanc B, Schuettengruber B, Bonnet J, Tixier V, Mas A, Cavalli G 2011. Polycomb-dependent regulatory contacts between distant Hox loci in Drosophila. Cell 144: 214–226 - PubMed
    1. Bau D, Sanyal A, Lajoie BR, Capriotti E, Byron M, Lawrence JB, Dekker J, Marti-Renom MA 2011. The three-dimensional folding of the α-globin gene domain reveals formation of chromatin globules. Nat Struct Mol Biol 18: 107–114 - PMC - PubMed
    1. Bolzer A, Kreth G, Solovei I, Koehler D, Saracoglu K, Fauth C, Muller S, Eils R, Cremer C, Speicher MR, et al. 2005. Three-dimensional maps of all chromosomes in human male fibroblast nuclei and prometaphase rosettes. PLoS Biol 3: e157 doi: 10.1371/journal.pbio.0030157 - PMC - PubMed
    1. Branco MR, Pombo A 2006. Intermingling of chromosome territories in interphase suggests role in translocations and transcription-dependent associations. PLoS Biol 4: e138 doi: 10.1371/journal.pbio.0040138 - PMC - PubMed

Publication types

LinkOut - more resources