. 2011 Dec;9(12):e1001226.
doi: 10.1371/journal.pbio.1001226. Epub 2011 Dec 27.

Structural basis of response regulator inhibition by a bacterial anti-activator protein

Affiliations

Structural basis of response regulator inhibition by a bacterial anti-activator protein

Melinda D Baker et al. PLoS Biol. 2011 Dec.

Abstract

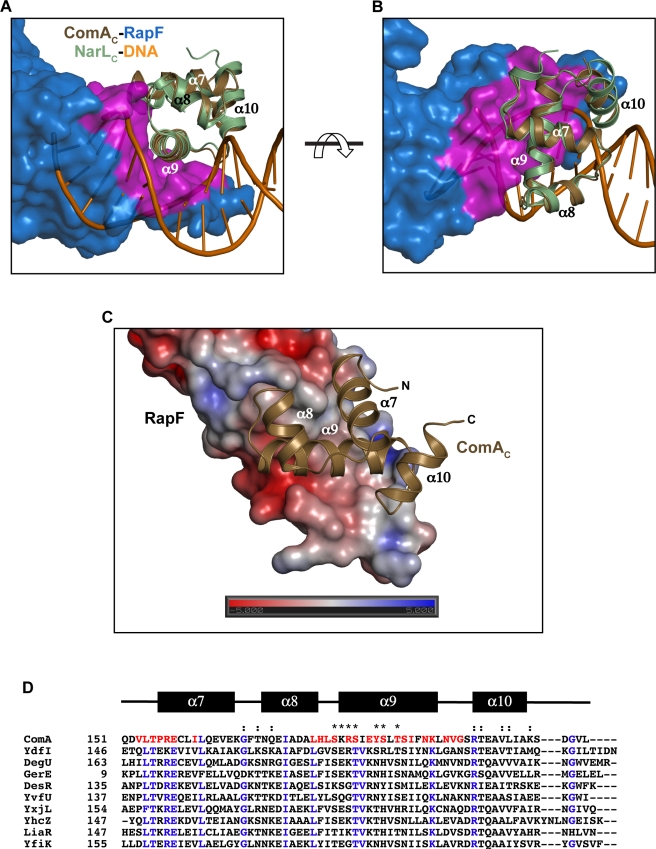
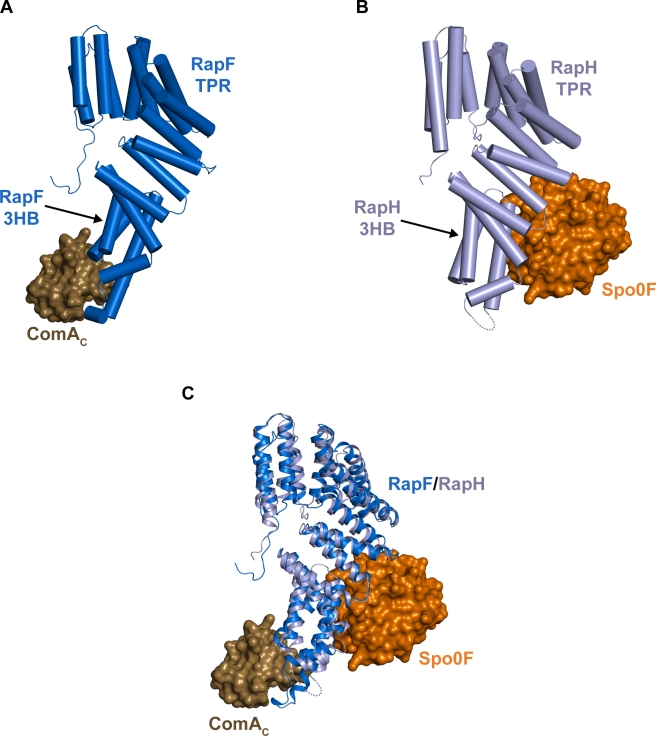
The complex interplay between the response regulator ComA, the anti-activator RapF, and the signaling peptide PhrF controls competence development in Bacillus subtilis. More specifically, ComA drives the expression of genetic competence genes, while RapF inhibits the interaction of ComA with its target promoters. The signaling peptide PhrF accumulates at high cell density and upregulates genetic competence by antagonizing the interaction of RapF and ComA. How RapF functions mechanistically to inhibit ComA activity and how PhrF in turn antagonizes the RapF-ComA interaction were unknown. Here we present the X-ray crystal structure of RapF in complex with the ComA DNA binding domain. Along with biochemical and genetic studies, the X-ray crystal structure reveals how RapF mechanistically regulates ComA function. Interestingly, we found that a RapF surface mimics DNA to block ComA binding to its target promoters. Furthermore, RapF is a monomer either alone or in complex with PhrF, and it undergoes a conformational change upon binding to PhrF, which likely causes the dissociation of ComA from the RapF-ComA complex. Finally, we compare the structure of RapF complexed with the ComA DNA binding domain and the structure of RapH complexed with Spo0F. This comparison reveals that RapF and RapH have strikingly similar overall structures, and that they have evolved different, non-overlapping surfaces to interact with diverse cellular targets. To our knowledge, the data presented here reveal the first atomic level insight into the inhibition of response regulator DNA binding by an anti-activator. Compounds that affect the interaction of Rap and Rap-like proteins with their target domains could serve to regulate medically and commercially important phenotypes in numerous Bacillus species, such as sporulation in B. anthracis and sporulation and the production of Cry protein endotoxin in B. thuringiensis.


Conflict of interest statement

The authors have declared that no competing interests exist.

Figures

Figure 1
Figure 1. The B. subtilis competence signal transduction pathway.
ComP autophosphorylates in response to binding the quorum-sensing signal ComX and subsequently phosphorylates ComA. ComA∼P drives transcription of the srfA operon that in turn triggers the expression of late-stage competence genes. RapC, RapF, and RapH inhibit the binding of ComA to its target promoters, repressing the induction of genetic competence. Mature Phr peptides are generated proteolytically from pro-Phr proteins during export. The Spo0K permease (not pictured) imports Phr peptides into the cytoplasm where they antagonize Rap protein function. H, histidine; D, aspartic acid; P, phosphoryl group.
Figure 2
Figure 2. RapF-ComAC structure.
(A) The RapF-ComAC crystallographic asymmetric unit. (B) RapF domain architecture with α-helices depicted as cylinders. HTH, helix-turn-helix. (C) RapF-ComAC oriented as in panel B and looking down the helical axis of the principal ComA DNA binding helix α9. RapF residues buried in the RapF-ComAC interface are colored magenta.
Figure 3
Figure 3. In vitro and in vivo activity of RapF mutants targeting the RapF-ComA interface.
(A) RapF (blue cartoon) in complex with ComAC (brown surface). (B) Expanded view of the area enclosed by the black square in panel A. RapF residues targeted for in vitro or in vivo functional analysis are depicted as magenta sticks. (C) Native PAGE analysis of RapF-ComA complexes. (D) In vivo activity of RapF and RapF mutants targeting the RapF-ComA interface measured as a function of PsrfA-luc. The inset panel shows that the PsrfA-luc strains exhibited similar ComA activity in the absence of induced RapF. Each curve is representative of at least three independent experiments performed in duplicate. T0 is the time of transition from exponential growth to the stationary phase. Western blotting showed that RapF was overexpressed from the Pspank(hy) promoter at 2.5 times the level of endogenously produced RapF at T0 (unpublished data). RLU, Relative Luminescence Units.
Figure 4
Figure 4. In vitro binding of wild-type RapF to His-ComA mutants targeting the RapF-ComA interface.
(A) RapF (blue surface) in complex with ComAC (brown cartoon). (B) Expanded view of the area enclosed by the black rectangle in panel A. (C) RapF interaction with the principal ComA DNA binding helix α9 (brown helix). (D) The binding of wild-type RapF to His-ComA mutants corresponding to the residues depicted as magenta sticks in panels B and C was determined by native PAGE.
Figure 5
Figure 5. Analysis of RapF complexes in solution.
(A) Size exclusion chromatography of RapF (peak elution volume (V R) 14.11 ml), ComA2 (V R 14.75 ml), and RapF-ComA (RapF-ComA V R 13.43 ml, uncomplexed ComA V R 14.80 ml). SDS-PAGE analyses of the indicated fractions are shown below the traces. The peak positions of gel filtration standards are indicated by vertical lines above the traces. (B) Sedimentation equilibrium data for 50 µM RapF (filled circles) and 50 µM RapF-ComA (open triangles). Centrifugation was carried out at 13,000 rpm (RapF) or 9,000 RPM (RapF-ComA) and 20°C as described in the Materials and Methods. Bottom, the measured absorbance at 286 nm (RapF) or 285 nm (RapF-ComA) versus the radius (distance to the center of the rotor) is shown. The continuous line represents the result from a single exponential fit of the data points. Top, the residuals to the fit expressed as the difference between experimental and fitted values. The residuals for the RapF-ComA sample deviated from zero in a systematic fashion, suggesting the presence of non-specific interactions probably between weakly associating ComA dimers in buffer A (see Materials and Methods). (C) Size exclusion chromatography of RapF as in panel A (V R 14.11 ml) and RapF+PhrF (V R 15.12 ml). SDS-PAGE analysis and peak positions of gel filtration standards are depicted as in panel A. (D) Sedimentation equilibrium data for 50 µM RapF (open circles) mixed with 500 µM PhrF. Top and bottom graphs are depicted as in panel B. Centrifugation was carried out at 13,000 rpm and 20°C as described in Materials and Methods. The absorbance was measured at 286 nm. (E) Size exclusion chromatography of RapF-ComA as in panel A (RapF-ComA V R 13.43 ml and uncomplexed ComA2 V R 14.80 ml) and RapF-ComA+PhrF (V R 15.06 ml). Due to their similar size, the RapF-PhrF and ComA2 peaks overlap. SDS-PAGE analysis and gel filtration standards are depicted similarly as in panel A. See Table 1 for the molecular weights calculated from the SEC and SE AUC shown in panels A–E. (F) Structural alignment of ComAC from the RapF-ComAC X-ray crystal structure with a molecule of the ComAC homodimer (2KRF) . The ComAC backbone atoms aligned with a root mean-square deviation of 1.40 Å. The dimerization interface consists primarily of residues in helix α10 and the α7–α8 loop. ComAC residues buried in the RapF-ComAC interface are colored green. For clarity, RapF is omitted.
Figure 6
Figure 6. RapF mimics DNA.
(A) Structural alignment of ComAC of the RapF-ComAC structure with a molecule of NarLC of the NarLC-DNA structure (1JE8) oriented looking down the helical axis of ComAC helix α9 shows that the RapF ComA binding surface (magenta) resembles the shape of the DNA major groove. The ComAC and NarLC Cα backbone atoms aligned with a root mean-square deviation of 0.60 Å. (B) Top view of the alignment shown in panel A obtained by rotating panel A 90° in the direction indicated by the arrow. (C) The RapF electrostatic surface potential was calculated using APBS and displayed on the solvent-accessible surface. Electronegative and electropositive surfaces are colored red and blue, respectively, and contoured from −5 to +5 kT/e. (D) B. subtilis LuxR/FixJ/NarL-type family member HTH DNA binding domain amino acid sequence alignment. Highly conserved residues are indicated with blue type. ComA secondary structure assignments are denoted by the black rectangles above the sequences. ComA residues buried in the RapF interface are indicated with red type. Asterisks and colons above the sequences denote ComA DNA binding residues and ComAC dimerization interface residues, respectively .
Figure 7
Figure 7. ComAC and Spo0F bind to different Rap protein surfaces.
(A) Side view of the RapF-ComAC complex. (B) Side view of the RapH-Spo0F complex (3Q15) . This view was obtained by aligning RapH of the RapH-Spo0F complex with RapF of the RapF-ComAC complex as oriented in panel A and as described in (C). Dashed lines denote the RapH disordered region as described below. A comparison of panels A and B shows that ComAC and Spo0F bind to opposite faces of the RapF and RapH 3-helix bundles, respectively, and that Spo0F also interacts with the RapH TPR domain. (C) Side view of RapF of the RapF-ComAC structure aligned with RapH of the RapH-Spo0F structure. The RapF and RapH Cα backbone atoms aligned with a root mean-square deviation of 1.61 Å. We previously observed insufficient electron density corresponding to RapH residues 69–76, and they were not included in the RapH-Spo0F model . These residues correspond to the C-terminus of RapF helix α3 and a portion of the RapF linker region including the 310 helix. This region appears to be ordered in the RapF structure resulting from extensive interactions with ComA. Structural alignment of RapF of the RapF-ComAC structure with RapH of the RapH-Spo0F structure also revealed conformational differences in the regions surrounding the RapF and RapH α2–α3 loops. This area contains residues particularly important for Rap phosphatase activity, including a catalytic residue that inserts into the Spo0F active site. Thus, the conformational differences between RapF and RapH near the α2–α3 loop likely result from Spo0F binding to RapH.

References

    1. Gao R, Stock A. M. Biological insights from structures of two-component proteins. Annu Rev Microbiol. 2009;63:133–154. - PMC - PubMed
    1. Bongiorni C, Ishikawa S, Stephenson S, Ogasawara N, Perego M. Synergistic regulation of competence development in Bacillus subtilis by two Rap-Phr systems. J Bacteriol. 2005;187:4353–4361. - PMC - PubMed
    1. Core L, Perego M. TPR-mediated interaction of RapC with ComA inhibits response regulator-DNA binding for competence development in Bacillus subtilis. Mol Microbiol. 2003;49:1509–1522. - PubMed
    1. Ogura M, Shimane K, Asai K, Ogasawara N, Tanaka T. Binding of response regulator DegU to the aprE promoter is inhibited by RapG, which is counteracted by extracellular PhrG in Bacillus subtilis. Mol Microbiol. 2003;49:1685–1697. - PubMed
    1. Smits W. K, Bongiorni C, Veening J. W, Hamoen L. W, Kuipers O. P, et al. Temporal separation of distinct differentiation pathways by a dual specificity Rap-Phr system in Bacillus subtilis. Mol Microbiol. 2007;65:103–120. - PubMed

Publication types

MeSH terms

Associated data