. 2011 Dec;7(12):e1002449.
doi: 10.1371/journal.ppat.1002449. Epub 2011 Dec 22.

Prion uptake in the gut: identification of the first uptake and replication sites

Affiliations

Prion uptake in the gut: identification of the first uptake and replication sites

Pekka Kujala et al. PLoS Pathog. 2011 Dec.

Abstract

After oral exposure, prions are thought to enter Peyer's patches via M cells and accumulate first upon follicular dendritic cells (FDCs) before spreading to the nervous system. How prions are actually initially acquired from the gut lumen is not known. Using high-resolution immunofluorescence and cryo-immunogold electron microscopy, we report the trafficking of the prion protein (PrP) toward Peyer's patches of wild-type and PrP-deficient mice. PrP was transiently detectable at 1 day post feeding (dpf) within large multivesicular LAMP1-positive endosomes of enterocytes in the follicle-associated epithelium (FAE) and at much lower levels within M cells. Subsequently, PrP was detected on vesicles in the late endosomal compartments of macrophages in the subepithelial dome. At 7-21 dpf, increased PrP labelling was observed on the plasma membranes of FDCs in germinal centres of Peyer's patches from wild-type mice only, identifying FDCs as the first sites of PrP conversion and replication. Detection of PrP on extracellular vesicles displaying FAE enterocyte-derived A33 protein implied transport towards FDCs in association with FAE-derived vesicles. By 21 dpf, PrP was observed on the plasma membranes of neurons within neighbouring myenteric plexi. Together, these data identify a novel potential M cell-independent mechanism for prion transport, mediated by FAE enterocytes, which acts to initiate conversion and replication upon FDCs and subsequent infection of enteric nerves.


Conflict of interest statement

The authors have declared that no competing interests exist.

Figures

Figure 1
Figure 1. Follicle-associated epithelium (FAE) harbours enterocytes that have large apical late endosomal compartments and M cells.
Peyer's patches were collected from wild-type 29/Ola mice 1 day after infection with ME7 prions. (A) Cellular organization of a Peyer's patch showing the LAMP1-positive compartments at the FAE and SED. (B) FAE enterocytes have large LAMP1-positive endosomes compared to enterocytes in the villi. (C and D) UEA-1 positive (red) M cells within the FAE. Note in (D) the large apical LAMP1+ endosomes are not present in M cells, but only in adjacent FAE enterocytes (arrowheads). N depicts the approximate location of nucleus in the epithelium (E) UEA-1 label is present only on FAE, whereas the neighbouring villus is negative. IgG (green) presents the endogenous mouse IgGs. (F and G) Cryo-immuno EM reveals that M cells in the FAE differ from enterocytes by having irregular microvilli that are UEA-1–positive (F, G). The diameter of the UEA-1–specific gold particles in (F) and (G) is 15 nm. Note in (F) the arrow points to a PrP-positive early endosomal vesicle in the UEA-1 negative enterocyte, whereas little PrP uptake is detectable in the UEA-1 positive M cell. PrP was detected with PrP-specific 6H4 monoclonal antibody directly conjugated to UltraSmall gold (PrP-usg) and visualized by silver enhancement. A larger high resolution version of Figure 1F is provided as a supplement (Figure S3). SED, subepithelial dome; GC, germinal centre; V, villus; M, M cells; E, enterocytes. Scale bars: (A) 80 µm; (B) 15 µm; (C) 10 µm; (D) 15 µm; (E) 20 µm; (F) 200 nm and (G) 200 nm.
Figure 2
Figure 2. Subcellular localization of neurofilament and PrP uptake in FAE and SED.
Neurofilaments (A) and PrP (B–F) were observed in wild type 129/OLA mice at 1 dpf after oral prion exposure. (A) Neurofilaments (bright red) can be detected in LAMP1-positive endosomes (green) in the FAE (white arrows) and in larger LAMP1-positive structures in macrophages in the SED. (B) PrP can occasionally be seen in small electron-lucent early endosomal structures of FAE enterocytes, shown at higher magnification in (C, arrows). (D–F) Most of the PrP signal in FAE of infected animals is found in LAMP1-positive, late endosomes of enterocytes. Late endosomes with electron-dense contents (arrows) are labelled with LAMP1 (D and F); PrP was detected with PrP-specific 6H4 monoclonal antibody directly conjugated to UltraSmall gold (PrP-usg) (E and F) visualized by silver enhancement for 5 min (E) or 1 min (F). Arrows in (E) point to PrP-usg-labelled late endosomes. (F) White arrowheads indicate PrP-specific label within LAMP1-positive multivesicular bodies and between the apical microvilli facing the intestinal lumen. Black arrows indicate LAMP1 labelling (15 nm gold) on the limiting membrane of these structures. A larger high resolution version of Figure 2F is provided as a supplement (Figure S4). Scale bars: (A) 8 µm; (B) 250 nm; (C) 125 nm; (D) 600 nm; (E) 500 nm and (F) 300 nm.
Figure 3
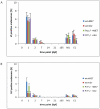
Figure 3. Quantification of neurofilament- and PrP-positive late endosomes.
LAMP1 positive endosomes that were also positive for neurofilament (A) and PrP-specific gold particles (B) in wild-type and PrP-deficient mice following oral prion infection (in dpf, x axis). Similar quantifications of NF and PrP in wt and Prnp –/– mice fed normal brain homogenate (+nbr) are also shown. Mean percentages ± SD from the two most proximal Peyer's patches per mouse and two mice per group are shown for 100 randomly selected FAE enterocytes. The apical LAMP1 positive endosomes between the brush border and nucleus were counted. In this apical region there are in average between 3 to 6 LAMP1 positive endosomes per section of a cell. Analogously, 100 FAE M cells (M1) and 100 randomly selected villus enterocytes (E1) were analysed for LAMP1-positive late endosomes at 1 dpf, the time point of highest scores, are also shown. NF was examined by IF; PrP was evaluated by cryo-immunogold EM.
Figure 4
Figure 4. Two separate subpopulations of phagocytic monocytes in SED.
In the SED a subpopulation of phagocytic monocytes with large LAMP1-positive compartments also label for ferritin, a macrophage marker. 129/Ola wild type mice were infected with ME7 prions and visualized at 1 dpf. (A) MHCII-positive dendritic cells appear to be separate populations from the cells that harbour large LAMP1 vacuoles at the SED. (B) By comparison, cells with large LAMP1 compartments also express ferritin (red). (C and D) Apoptotic lymphocytes were seen by TUNEL staining (green in C) inside ferritin-positive macrophages (red in C) and as electron-dense dark bodies in the late endosomal/lysosomal compartments (D). These typical tingible body macrophages (TBMs) were found further away from SED in the germinal centre. (E) A mononuclear phagocyte at SED appears to have exocytosed some of its LAMP1-positive endosomal compartments into the intercellular space (arrows). Scale bars: (A) and (B) 12.5 µm; (C) 8 µm; (D) 2.4 µm and (E) 200 nm.
Figure 5
Figure 5. Increased PrP accumulation upon FDCs through the course of early prion disease.
(A–E) In samples taken from Peyer's patches of wt mice at 21 dpf with ME7 prions, PrP accumulates in the germinal centres on the surface of mature FDCs. (A-C) Overviews show mature FDCs at the germinal centre. (D–E) In samples taken from wt mice at 21 dpf with ME7 prions, increased PrP labelling was observed on the cell surface of FDCs. Panel E shows an inset in D at higher magnification, with arrows indicating the silver enhanced mAb 6H4-conjugated UltraSmall gold PrP label (PrP-usg). The arrow in panel D indicates a desmosome. (F) Trypsin treatment of sections (white bar; scrapie +T) causes an average decrease of 84% in the amount of PrP-specific label on FDC plasma membranes of PrP-infected mice when compared to untreated sections (black bar; scrapie -T; 100%). The remaining PrP after trypsin treatment is indicative for protease-resistant disease related PrPSc. Untreated (black bar, control -T) and trypsin-treated (grey bar, control +T) sections from uninfected mice show little PrP-specific label. Samples were collected at 21 dpf and the FDC plasma membrane bound PrP-specific gold was counted in untreated and trypsin treated Peyer's patch cryosections of ME7 infected mice and noninfected controls. Ten mature FDC cells in the germinal centre were randomly selected and 50 µm of plasma membrane was analysed per cell. A total membrane length of 500 µm per treatment was analysed and the result is given as a relative labelling density per membrane length ± SED. L; lymphocyte. Scale bars: (A) 5 µm; (B) 2 µm; (C) 1 µm; (D) 500 nm and (E) 200 nm.
Figure 6
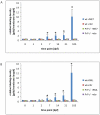
Figure 6. An increase of PrP label upon FDCs of wt mice only.
Quantification of PrP label on the plasma membrane of FDCs indicates a clear increase of PrP label in wt mice between 2 and 7 dpf with either ME7 (A) or RML (B) prions compared to wt and PrP-/- animals that were fed with normal brain homogenate (nbr) or PrP-/- animals fed with ME7 or RML prions, respectively. The labelling density was counted as gold particles/membrane length (µm). The x axis indicates the number of days after oral infection at which samples were taken. A gold particle was defined as membrane associated if it was not further than 20 nm away from the membrane leaflet. The two most proximal Peyer's patches per mouse and two mice per group were analysed. Only plasma membranes of cells with typical FDC morphology in GCs (cells with lightly electron-lucent, bilobular nucleus that were in cellular contact with ≥1 non-apoptotic lymphocytes) were counted. A total membrane length of 1000 µm per sample was analysed. Asterisks indicate a statistically significant difference between wt mice infected with prions compared to other groups, p<0,05.
Figure 7
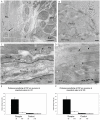
Figure 7. PrP positive endosomes in the germinal centre of Peyer's patch of wt mouse exposed to ME7 prions.
Silver enhanced cryo-immuno EM labeling of PrP with mAb 6H4 conjugated to UltraSmall gold (PrP-usg) shows increased numbers of PrP-positive late endosomes and lysosomes of tingible body macrophages (TBMs) in germinal centres of wt mice at 21 dpf. Areas framed by white lines in panels A and C are shown at higher magnification in panels B and D, respectively. Arrows in B and D point to PrP-positive, late endosomes/lysosomes. L; lymphocyte. (E) After trypsin treatment an average of 48% of the PrP-specific label (white bar; scrapie +T) remains in the lumen of late endosomes/lysosomes of PrP-infected mice when compared to untreated PrP-infected mice (black bar; scrapie -T; 100%). The remaining PrP after trypsin treatment is indicative for protease-resistant disease related PrPSc. Untreated (black bar, control -T) and trypsin-treated (grey bar, control +T) uninfected mice show little late endosome/lysosome associated PrP-specific label. Samples were collected at 21 dpf and the PrP-specific gold was counted in the lumen of late endosomes/lysosomes of tingle body macrophages in germinal centres of untreated and trypsin treated cryosections of Peyer's patch from ME7 infected mice and noninfected controls. A total of 100 late endosomes/lysosomes per treatment were analysed and the result is given as a relative labeling density per area ± SED. Scale bars: (A) and (C): 1 µm; (B) 300 nm and (D) 250 nm.
Figure 8
Figure 8. First PrP observed in myenteric plexi.
PrP labelling is observed in myenteric plexi in samples from wt mice taken at 21 dpf. (A) Overview of the edge of a Peyer's patch (PP), submucosa (S) and the underlying muscle layer (Mu). The arrow points to the myenteric plexus. (B) Higher magnification view of the plexus (boxed area in A) shows a high density of silver enhanced PrP label (mAb 6H4 conjugated to UltraSmall gold (PrP-usg)) on the plasma membrane of myenteric neurons. (C and D) Micrographs show that the smooth muscle cells surrounding the plexi have numerous electron lucent caveosomes on their surface (arrows in C indicate caveosome-rich areas, arrowheads in D indicate individual caveosomes), some of which are PrP-positive (arrows in D). Dotted line in C depicts the border between the plexus and muscle layer. (E and F) After trypsin treatment an average of 9% at 21 dpf (E) and 15% at 105 dpf (F) of the PrP-specific label (white bar, scrapie +T) remains on the surface of neurons at myenteric plexi of PrP-infected mice when compared to untreated PrP-infected mice (black bar; scrapie -T ; 100%). Untreated (black bar,control -T) and trypsin-treated (grey bar, control +T) uninfected mice show little myenteric plexi associated PrP-specific label. The PrP-specific gold was counted on the surface of neurons at the myenteric plexi of untreated and trypsin treated cryosections of Peyer's patch from ME7 infected mice and noninfected controls. A total of 10 myenteric plexi per treatment were analysed and the result is given as a relative labelling density per area ± SED. Scale bars: (A) 4 µm; (B) 300 nm; (C) 250 nm and (D) 200 nm.
Figure 9
Figure 9. The endothelial marker A33 is found in FAE and SED of Peyer's patches from wt mice.
(A) A33 (red) labels basolateral plasma membranes of FAE enterocytes. (B and C) Some A33-positive membrane components can be found in association with LAMP1-positive (green) subcellular compartments on (B) dendritic cells/macrophages in the subepithelial dome (SED; arrows) as well as (C) on the cell surfaces of the FDC network on germinal centres (GC). (D–F) Some multivesicular bodies of FAE seem to fuse with the plasma membrane (arrows in D and E; PM; dotted line), releasing their intravacuolar membranes as exosomes into the extracellular space (arrows in F). For these images 129/Ola wt mice were infected and analysed at 7 dpf. V; villus. Labeled antigens: A33 (D); PrP (silver enhanced mAb 6H4 conjugated to UltraSmall gold, PrP-usg) (E) and LAMP1 (F). Scale bars: (A–C) 20 µm; (D–E) 200 nm; and (F) 250 nm.
Figure 10
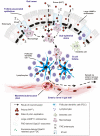
Figure 10. Proposed model for the for prion neuroinvasion from gut lumen via Peyer's patches to enteric nervous system.
(1) Data in the current study suggest that prion uptake from gut lumen occurs predominantly via large LAMP1 positive endosomes of FAE enterocytes with (2) much lower levels via M cells. (3) FAE enterocytes release prions to SED with Gpa33+ exosomes. (4) SED macrophages uptake and release Gpa33+ exosomes and prions to their environment. (5) Prions and Gpa33+ exosomes spread to the germinal centers by TBMs (6) Prions and FAE-derived Gpa33+ exosomes accumulate on surface of FDCs in the germinal centers. Prions start to replicate on the surface of FDCs. (7) Prions replicate and spread to CNS via enteric nerves close to Peyer's patches.

Similar articles

Cited by

References

    1. Prusiner SB. In: Fields Virology. Knipe DM, Howley PM, editors. Philadelphia: Lippincott Williams & Wilkins; 2007. pp. 3359–3091.
    1. Blattler T, Brandner S, Raeber AJ, Klein MA, Voigtlander T, et al. PrP-expressing tissue required for transfer of scrapie infectivity from spleen to brain. Nature. 1997;389:69–73. - PubMed
    1. Brandner S, Isenmann S, Raeber A, Fischer M, Sailer A, et al. Normal host prion protein necessary for scrapie-induced neurotoxicity. Nature. 1996;379:339–43. - PubMed
    1. Bueler H, Aguzzi A, Sailer A, Greiner RA, Autenried P, et al. Mice devoid of PrP are resistant to scrapie. Cell. 1993;73:1339–47. - PubMed
    1. Peretz D, Williamson RA, Matsunaga Y, Serban H, Pinilla C, et al. A conformational transition at the N terminus of the prion protein features in formation of the scrapie isoform. J Mol Biol. 1997;273:614–22. - PubMed

Publication types

MeSH terms