. 2011 Dec;7(12):e1002404.
doi: 10.1371/journal.pgen.1002404. Epub 2011 Dec 22.

Acute multiple organ failure in adult mice deleted for the developmental regulator Wt1

Affiliations

Acute multiple organ failure in adult mice deleted for the developmental regulator Wt1

You-Ying Chau et al. PLoS Genet. 2011 Dec.

Abstract

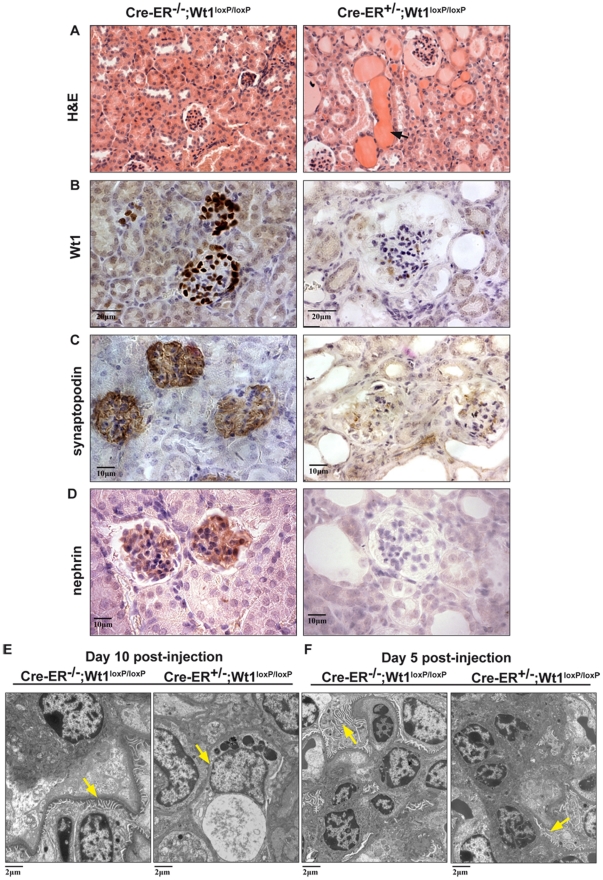
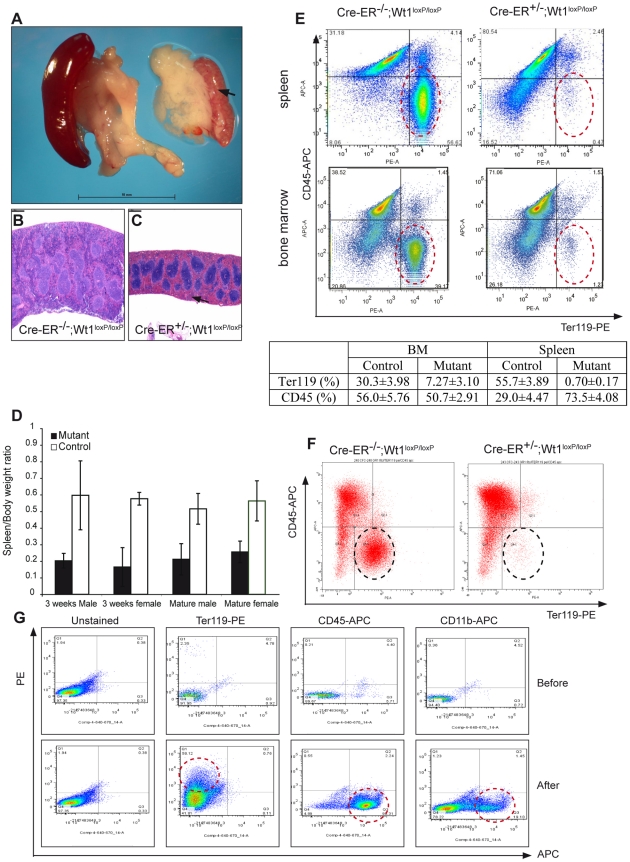
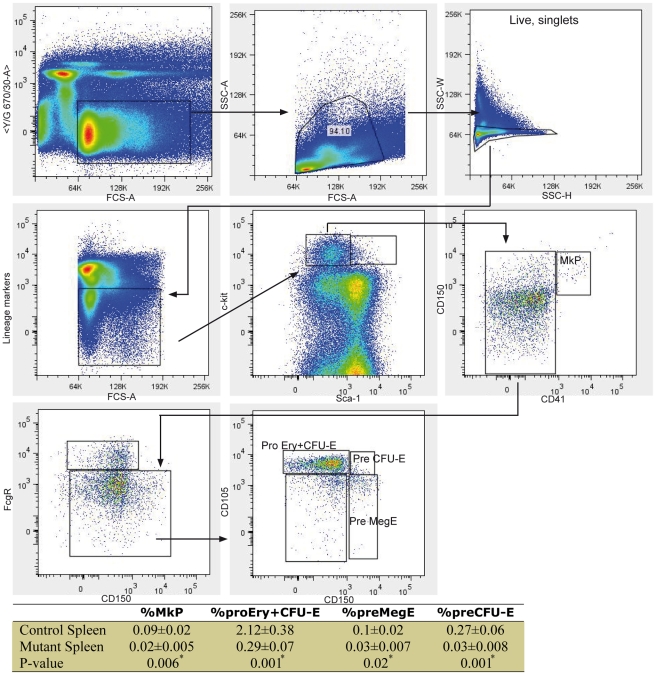
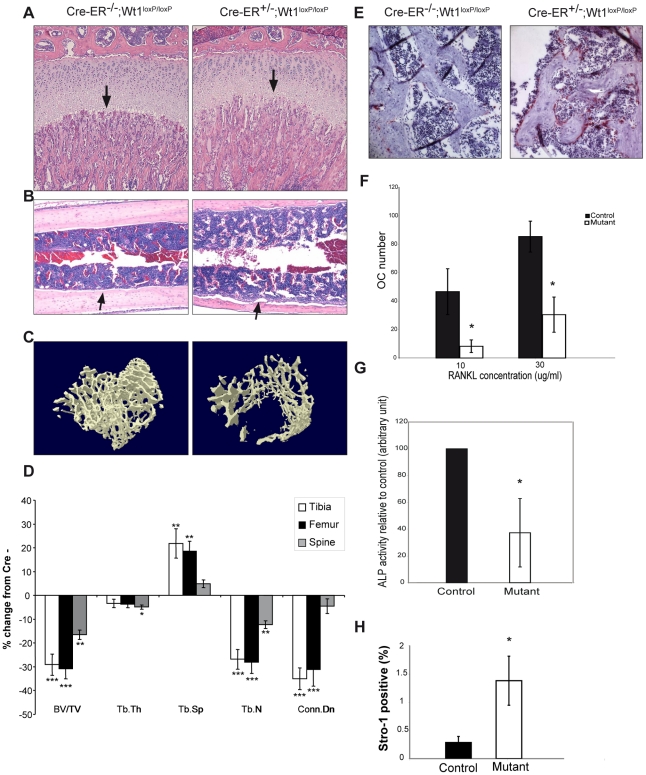
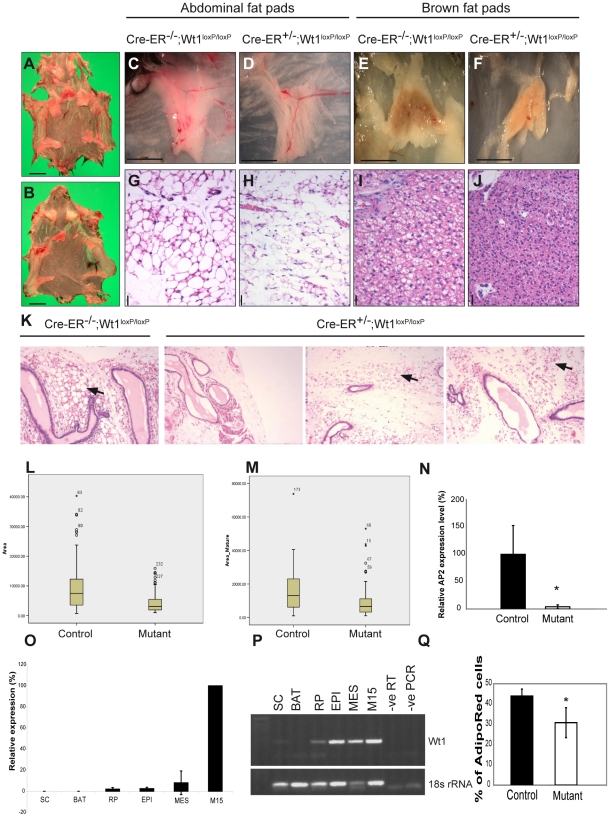
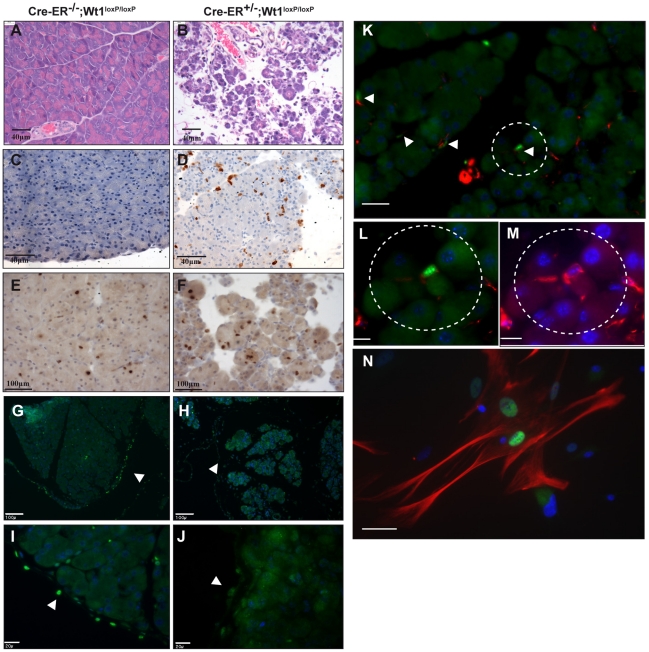
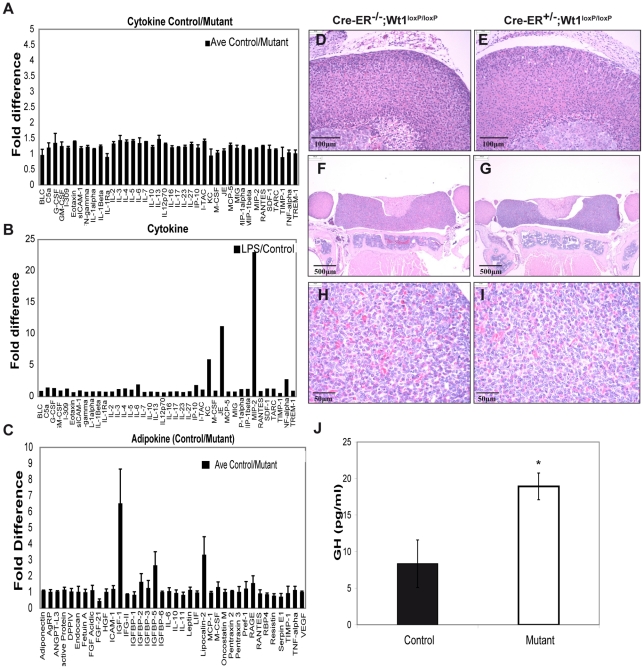
There is much interest in the mechanisms that regulate adult tissue homeostasis and their relationship to processes governing foetal development. Mice deleted for the Wilms' tumour gene, Wt1, lack kidneys, gonads, and spleen and die at mid-gestation due to defective coronary vasculature. Wt1 is vital for maintaining the mesenchymal-epithelial balance in these tissues and is required for the epithelial-to-mesenchyme transition (EMT) that generates coronary vascular progenitors. Although Wt1 is only expressed in rare cell populations in adults including glomerular podocytes, 1% of bone marrow cells, and mesothelium, we hypothesised that this might be important for homeostasis of adult tissues; hence, we deleted the gene ubiquitously in young and adult mice. Within just a few days, the mice suffered glomerulosclerosis, atrophy of the exocrine pancreas and spleen, severe reduction in bone and fat, and failure of erythropoiesis. FACS and culture experiments showed that Wt1 has an intrinsic role in both haematopoietic and mesenchymal stem cell lineages and suggest that defects within these contribute to the phenotypes we observe. We propose that glomerulosclerosis arises in part through down regulation of nephrin, a known Wt1 target gene. Protein profiling in mutant serum showed that there was no systemic inflammatory or nutritional response in the mutant mice. However, there was a dramatic reduction in circulating IGF-1 levels, which is likely to contribute to the bone and fat phenotypes. The reduction of IGF-1 did not result from a decrease in circulating GH, and there is no apparent pathology of the pituitary and adrenal glands. These findings 1) suggest that Wt1 is a major regulator of the homeostasis of some adult tissues, through both local and systemic actions; 2) highlight the differences between foetal and adult tissue regulation; 3) point to the importance of adult mesenchyme in tissue turnover.


Conflict of interest statement

The authors have declared that no competing interests exist.

Figures

Figure 1
Figure 1. Severe kidney phenotype in the adult conditional Wt1 KOs.
A, At day 10 post-injection, H&E staining of paraffin sections showing accumulation of protein cast in the mutant kidney (right) c.f. control (left). B, Kidney sections stained with a Wt1-specific antibody in the mutant kidney (right) c.f. control (left); scale bar, 20 µm. C, Immunostaining of a podocyte marker synaptopodin; scale bar, 10 µm. D, Immunostaining of nephrin in the control and mutant kidney (right); scale bar, 10 µm. E, EM studies show the presence of foot process (arrows) of the podocytes in control mice (left) while the foot process is completely abolished in the mutants (right) at day 10 postinjection. F, At day 5 post-injection, effacement of foot process starts to show in the mutants c.f. the normal controls; scale bar, 2 µm.
Figure 2
Figure 2. Deletion of Wt1 leads to an aberrant haematopoietic system.
A, Images of mutant spleen (arrow) compared with control spleen (injected at 3 week old); scale bar, 10 mm. (B,C) H&E staining show depletion of the red pulp compartment in the mutant spleen (C, arrow) c.f. in the control spleen (B; injected at 10 week old);scale bar, 400 µm. D, Analysis of the spleen to body weight ratio (control, black; mutant, white box). E, FACS analysis of spleen and bone marrow cells with CD-45 APC(y-axis) and Ter-119 PE(x-axis, red circles). The percentage of CD45 and Ter119 positive cells is summarised in the table. F, FACS analysis of Ter119-PE and CD45-APC on control and mutant bone marrow cells grown in a methylcelluose based medium, where Wt1 is deleted in vitro by culturing with 4-OH tamoxifen (1 µM). G, FACS analysis of Ter119, CD45, and CD11b on FACS-sorted GFP positive bone marrow cells (from Wt1-GFP knockin mice) before and after grown in a methylcellulose-based system.
Figure 3
Figure 3. High-resolution fractionation of erythroid progenitors in mutant spleen.
Spleen cells were stained with antibodies against Sca-1, c-kit, CD41, CD150, FcgR, CD105, and a cocktail mixture of mature blood cell lineage markers (Lineage). Cells were also stained with 7-AAD and only live cells are displayed. Representative flow cytometric profiles are illustrated. The percentage of MkP, Pro Ery+CFU-E, Pre MegE, and Pre CFU-E in control and mutant spleens is listed.
Figure 4
Figure 4. Deletion of Wt1 leads to rapid bone loss.
A, H&E staining show defects in the Wt1-mutant growth plates (arrows; injected at 3 week old). B, H&E sections of long bone from control and mutant mice (injected at 3 week old). C, uCT images of trabecular bone of femurs from mutant (right) and control mice (left) injected at 10 weeks old. D, Bone histomorphometry analysis on tibia, femur, and spine. Values are expressed as % of change from control mice (8 mutants and 8 control mice were analysed). BV/TV: percentage trabecular bone volume; Tb.Th: Trabecular thickness; Tb.Sp: Trabecular spacing; Tb.N: Trabecular number; Conn.Dn: Connectivity density. *:p<0.05; **:p<0.01; ***:p<0.001. E, TRAcP staining (red) showing osteoclasts in the bone section. F, Analysis of in vitro osteoclast formation ability from control and mutant bone marrow cells in the presence of RANKL at various concentrations (10 and 30 µg/ml). G, Analysis of alkaline phosphatase activity in osteoblasts, differentiated from bone marrow cells. H, FACS analysis of % of Stro-1 positive cells in control and mutant bone marrow.
Figure 5
Figure 5. Fat reduction following Wt1 deletion.
Skin pulps from control (A) and mutant (B) mice (injected at 3 week old); scale bar, 1 cm. (C,D) Images of abdominal fat pads. (E,F) Images of interscapular brown adipose tissue; scale bar, 5 mm. H&E staining of the corresponding fat pads is shown in G–J, respectively; scale bar, 25 µm. K, H&E sections of abdominal fat pads from mice injected at 13 week old (arrows indicate lipid vacuoles). Box plot of lipid vacuole size measurement of adipocytes in the abdominal fat pads from the younger group of mice (L) and from the matured group of mice (M). N, Quantitative PCR analysis of AP2 expression in the abdominal fat pads in control and mutant mice. O, Quantitative PCR analysis of relative level of Wt1 expression in different fat pads. P, RT-PCR showing Wt1 and 18s rRNA expression in fat pads. SC, subcutaneous; BAT, brown adipose tissue (interscapular brown adipose tissue); RP, retroperitoneal; EPI, epididymal; MES, mesenteric; M15, murine embryonic mesonephros-derived cell line (positive control for Wt1 expression). Q, FACS analysis of number of adipocytes positive for AdipoRed in control and mutant bone marrow (p-value = 0.018).
Figure 6
Figure 6. Deletion of Wt1 leads to atrophy in the exocrine pancreas.
(A, B) H&E staining show massive atrophy in the exocrine pancreas. Immunohistochemistry analysis show active caspase 3 (C,D; scale bar, 40 µm); Ki67 (E,F; scale bar, 100 µm) and Wt1-antibody (G,H). Nuclei are stained with DAPI (blue); scale bar, 100 µm. Higher magnification images are shown in I&J scale bar, 20 µm. K, Double immunofluorescence staining of pancreas sections with Wt1-antibody (green)and desmin antibody (red). Nuclei are stained with DAPI (blue); scale bar, 25 µm. Area circled in (K) is shown in a higher magnification in L&M; scale bar,10 µm. N, Double immunofluorescence of Wt1(green) and desmin (red) in cultured PSCs; scale bar 50 µm.
Figure 7
Figure 7. Cytokine, adipokine, and growth hormone analysis in control and mutant plasma.
A, Cytokine profiling in control and mutant plasma. B, Cytokine array performed using plasma from mouse treated with LPS. C, Results from adipokine array showing fold of difference in the level of adipokines between mutant and control mouse plasma. D &E, H&E staining of adrenal glands (control = left, mutant = right; scale bar = 100 µm). F&G, H&E staining of pituitary glands; scale bar = 500 µm. H&I, H&E staining of pituitary anterior lobes; scale bar = 50 µm. J, Measurement of growth hormone (GH) in mouse plasma using ELISA.

References

    1. Lepper C, Conway SJ, Fan CM. Adult satellite cells and embryonic muscle progenitors have distinct genetic requirements. Nature. 2009;460:627–631. - PMC - PubMed
    1. Kim I, Saunders TL, Morrison SJ. Sox17 dependence distinguishes the transcriptional regulation of fetal from adult hematopoietic stem cells. Cell. 2007;130:470–483. - PMC - PubMed
    1. Hohenstein P, Hastie ND. The many facets of the Wilms' tumour gene, WT1. Hum Mol Genet. 2006;15 Spec No 2:R196–201. - PubMed
    1. Kreidberg JA, Sariola H, Loring JM, Maeda M, Pelletier J, et al. WT-1 is required for early kidney development. Cell. 1993;74:679–691. - PubMed
    1. Martinez-Estrada OM, Lettice LA, Essafi A, Guadix JA, Slight J, et al. Wt1 is required for cardiovascular progenitor cell formation through transcriptional control of Snail and E-cadherin. Nat Genet. 2010;42:89–93. - PMC - PubMed

Publication types

MeSH terms