. 2011 Dec;7(12):e1002428.
doi: 10.1371/journal.pgen.1002428. Epub 2011 Dec 22.

Ror2 enhances polarity and directional migration of primordial germ cells

Affiliations

Ror2 enhances polarity and directional migration of primordial germ cells

Diana J Laird et al. PLoS Genet. 2011 Dec.

Abstract

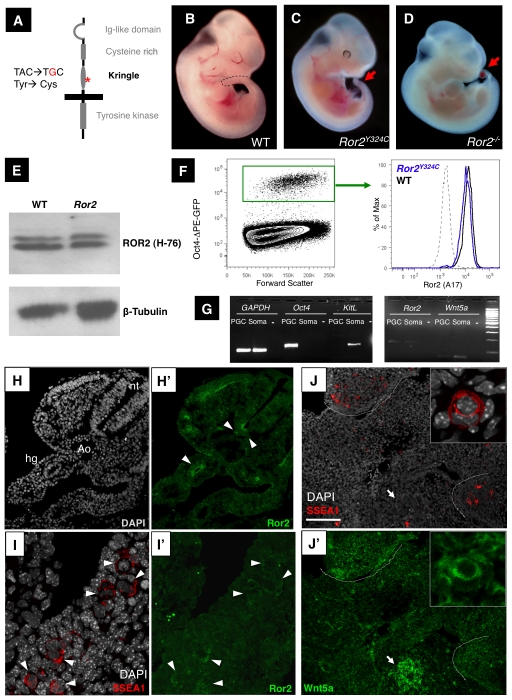
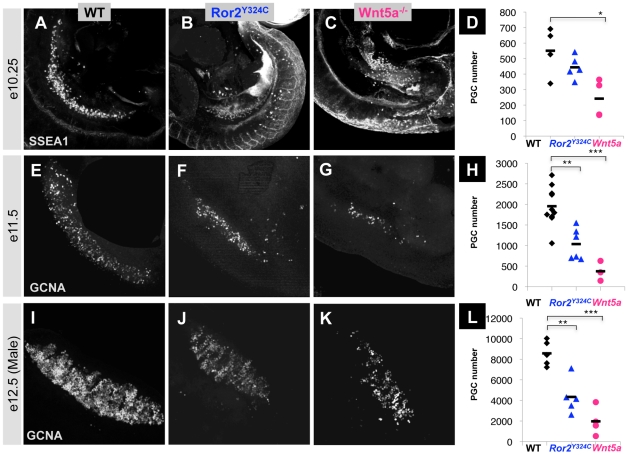
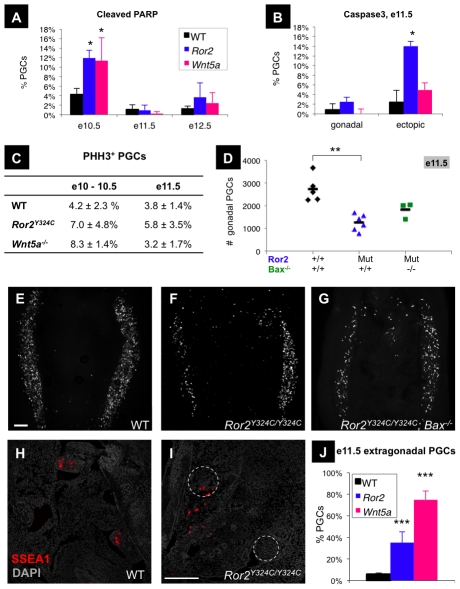
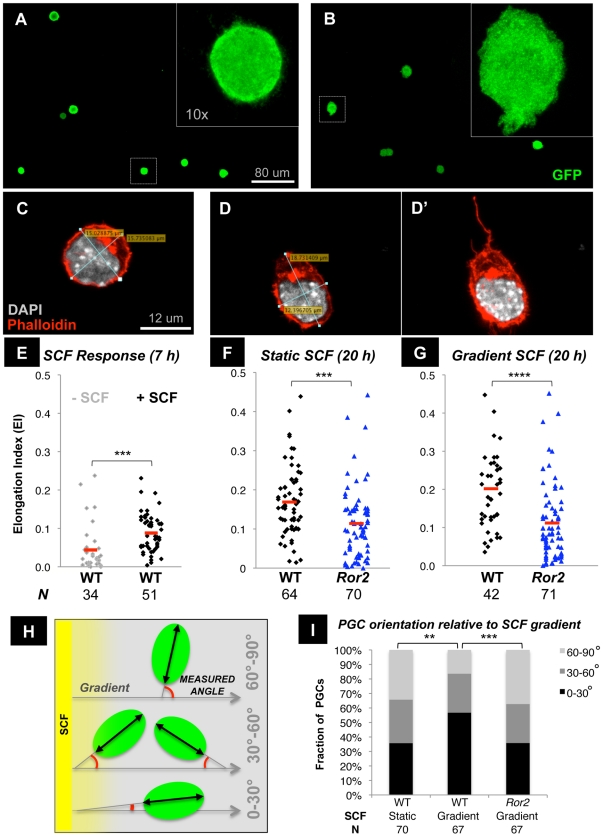
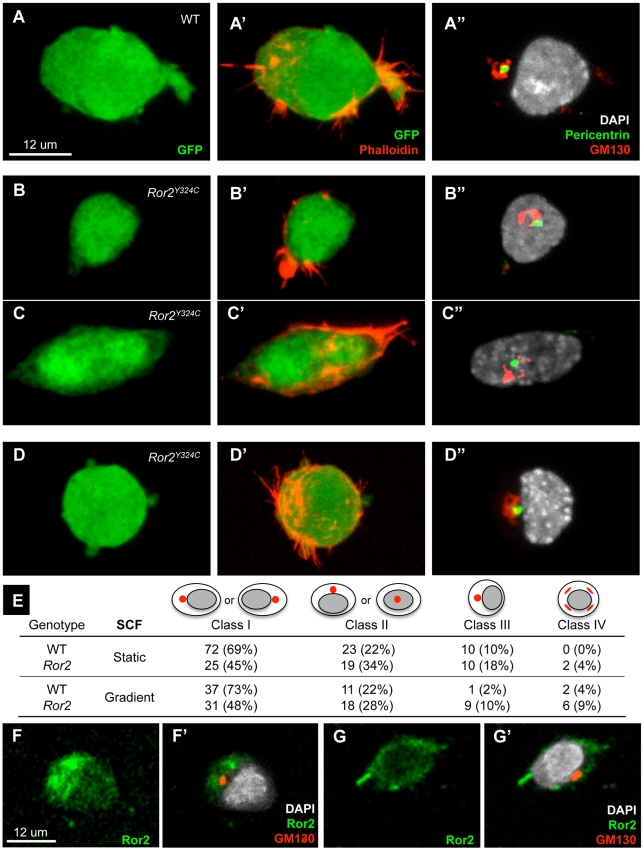
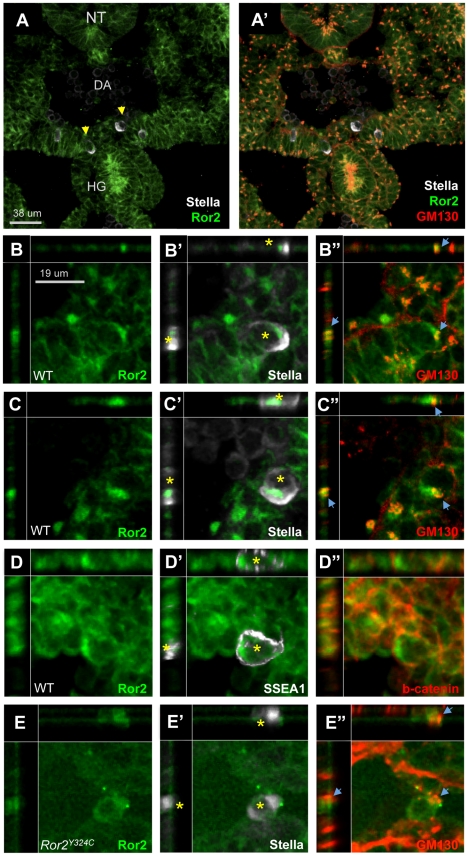
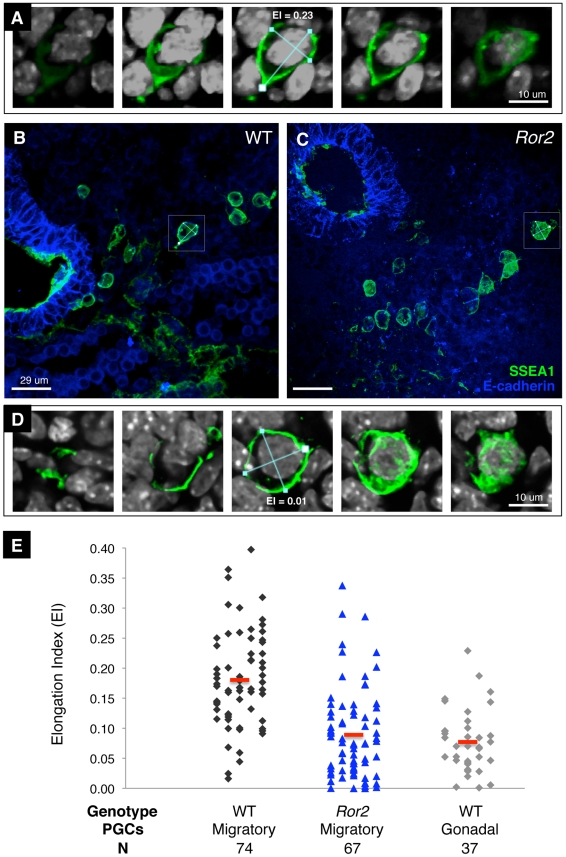
The trafficking of primordial germ cells (PGCs) across multiple embryonic structures to the nascent gonads ensures the transmission of genetic information to the next generation through the gametes, yet our understanding of the mechanisms underlying PGC migration remains incomplete. Here we identify a role for the receptor tyrosine kinase-like protein Ror2 in PGC development. In a Ror2 mouse mutant we isolated in a genetic screen, PGC migration and survival are dysregulated, resulting in a diminished number of PGCs in the embryonic gonad. A similar phenotype in Wnt5a mutants suggests that Wnt5a acts as a ligand to Ror2 in PGCs, although we do not find evidence that WNT5A functions as a PGC chemoattractant. We show that cultured PGCs undergo polarization, elongation, and reorientation in response to the chemotactic factor SCF (secreted KitL), whereas Ror2 PGCs are deficient in these SCF-induced responses. In the embryo, migratory PGCs exhibit a similar elongated geometry, whereas their counterparts in Ror2 mutants are round. The protein distribution of ROR2 within PGCs is asymmetric, both in vitro and in vivo; however, this asymmetry is lost in Ror2 mutants. Together these results indicate that Ror2 acts autonomously to permit the polarized response of PGCs to KitL. We propose a model by which Wnt5a potentiates PGC chemotaxis toward secreted KitL by redistribution of Ror2 within the cell.


Conflict of interest statement

The authors have declared that no competing interests exist.

Figures

Figure 1
Figure 1. A Ror2 ENU allele and expression in PGCs.
(A) Schematic of the Ror2 gene product with indicated mutation at nucleotide 1203 and predicted amino acid change. (B–D) Ror2Y324C homozygotes and (C) Ror2 null embryos (D) at ∼e10.75 exhibit a short tail (arrow). (E) Whole embryo lysates from e9.5 immunoblotted for ROR2 and β-Tubulin indicate that protein is present in Ror2Y324C homozygous mutants. (F) PGCs at e11.5 flow cytometrically identified by the Oct4ΔPE-GFP transgene (left) show comparable levels of ROR2 intracellular staining (right). (G) RT-PCR from WT sorted Oct4ΔPE-GFP+ (denoted PGC) and GFPneg tail somatic (soma) cells, and no cDNA controls (-) at e10.0 show the presence of Ror2 and Wnt5a in both populations. The purity of Oct4ΔPE-GFP+ cells was confirmed by the presence of Oct4 and absence of KitL. Both images are from the same gel, with 100 bp ladder shown at right. (H–H′) ROR2 immunostaining (green) in the ventral neural tube, hindgut and somites (arrowheads) of WT e10.5 sections. Scale bar = 100 um. (I–I′) ROR2 immunostaining (green) was present throughout WT e10.5 dorsal mesentery and appeared enriched on the surface of PGCs, coincident with SSEA1 (red). Scale bar = 24 um. (J–J′) In e11.5 transverse sections, WNT5A immunostaining (green) was enriched in the intestine (arrow) and gonadal ridges (dashed lines) where the majority of PGCs (red) reside. Nuclei are shown in grey. Variable levels of WNT5A signal were observed in PGCs, such as these two adjacent examples (inset, 5× magnification). Scale bar = 118 um.
Figure 2
Figure 2. PGC depletion in Ror2 and Wnt5a mutants.
(A–C) PGCs were visualized by wholemount SSEA1 immunostaining with SSEA1 antibody in e10.25 WT, Ror2, and Wnt5a embryos. (E–G) Gonadal ridges from e11.5 stained with GCNA, and (I–K) e12.5 male gonads stained with GCNA antibody. The caudal end is down in all images. (D, H, L) Quantification of PGCs in the entire e10.25 embryo, e11.5 and e12.5 gonads from confocal stacks, with individuals denoted as WT (diamond), Ror2Y324C mutants (triangle), and Wnt5a null (circle), and means indicated as bars. Consistent with appearances, a significant reduction of PGCs was observed in Wnt5a and from e11.5 onward in Ror2Y324C. We noted no significant difference in the number of PGCs between XX and XY gonads at e12.5 (not shown). Results of the Student's t-test are indicated, * p<0.05, **, p<0.01, ***p<0.001.
Figure 3
Figure 3. Increased PGC apoptosis and impaired colonization of the gonads in Ror2 and Wnt5a mutants.
(A) The frequencies of apoptotic PGCs were similar between all genotypes in e11.5 and e12.5 gonads, but increased in Ror2 and Wnt5a migratory PGCs at e10.5 (n = 4 mutants). (B) When examined separately in e11.5 sections, the frequency of apoptotic PGCs was similar in the gonads, but increased among ectopic extragonadal Ror2 PGCs compared to WT. (C) The frequencies of PHH3+ (ectopic and non-ectopic) PGCs determined from tissue sections at e10.5 and wholemount gonads at e11.5 did not differ between WT and either mutant by t-test (mean and SD of n≥3 embryos). (D–G) The number of PGCs within Ror2Y324C e11.5 mutant gonads was not rescued to WT levels (p = 0.065) on a Bax null background, quantified in (D). GCNA staining of e11.5 wholemount gonadal ridges in stage-matched WT (E) and Ror2Y324C single mutants (F) and Bax; Ror2Y324C double mutants (G). Scale bar = 120 um. (H–J) Excess ectopic PGCs were observed in e11.5 histologic sections of Ror2Y324C (I) and Wnt5a (not shown) stained with SSEA1 and DAPI (gonads indicated by dashed circles, scale bar = 100 um). (J) The proportion of extragonadal PGCs in Ror2Y324C and Wnt5a sections (mean and SE of n = 4 slides, ∼10 sections each) was significantly increased compared to WT. Results of the Student's t-test are indicated, * p<0.05, **, p<0.01, ***p<0.001.
Figure 4
Figure 4. Impaired elongation and alignment with an SCF gradient in cultured Ror2Y324C PGCs.
(A–B) Sorted e9.5 Oct4-ΔPE-GFP+ PGCs cultured 7 h on trigel without SCF (A) and with 50 ng/ml SCF (B), inset magnified 10×. (C–G) Cell axis measurements of the largest plane of the cell performed after staining with Phalloidin and DAPI are shown for representative round (C) and elongated (D) PGCs cultured ex vivo. A maximal projection of the confocal stacks (D′) depicts actin filament extensions of the elongated cell. An elongation index (EI) is calculated by (ALong−AShort)/(ALong+AShort) such that round cells approximate 0. The EI of WT PGCs increases after 7 h culture in static 50 ng/ml SCF (E), and is more pronounced by 20 h in WT (F). Ror2 PGCs remain less elongated in static (p = 0.0005) as well as graded SCF (G, p = 0.0004). Cell axis measurements shown are from n≥3 experiments. (H–I) The angle between the long cellular axis and the gradient was measured to determine PGC alignment with respect to SCF (H). WT PGCs cultured 20 h in graded SCF are biased toward low angles, whereas Ror2 PGCs exhibit a more random orientation, similar to WT in static SCF (I). Cell angle data represent n = 3 experiments.
Figure 5
Figure 5. Reduced polarization by SCF in cultured Ror2Y324C PGCs.
(A–D) Actin, centrosome and Golgi positions were examined in 20 h ex vivo cultured Oct4-ΔPE-GFP+ PGCs in the presence of SCF by GFP, Phalloidin, Pericentrin and GM130 immunofluorescence. (A–A″) An example of asymmetrically distributed GM130 and Pericentrin of an elongated cell, categorized as Class I. Class II contains elongated cells with centrally located GM130 and Pericentrin (B–B″, C–C″). Geometrically round cells comprise Class III, with GM130 and Pericentrin adjacent to the nucleus (D–D″). Dispersed GM130 was observed in a small fraction of cells that are likely dividing (not shown). (E) Quantification of cultured PGCs reveals a significant reduction of elongated Ror2 PGCs exhibiting asymmetric GM130/Pericentrin distribution (Class I, p = 0.005), similarly in static or graded SCF by Fisher's exact test. Also, in static SCF the number of elongated Ror2 PGCs with geometrically central GM130/Pericentrin distribution (Class II) was significantly higher than in WT (p = 0.029). Counts were accumulated from n = 3 experiments. (F–G) Ror2 and GM130 immunofluorescence on WT PGCs similarly cultured in SCF shows ROR2 localization on filopodia (F–F′) and asymmetrically on the cell surface and cytoplasm (G–G′).
Figure 6
Figure 6. Asymmetric localization of ROR2 in polarized migratory PGCs in vivo.
(A–E) Histologic sections from e10.25 WT embryos were immunostained with Stella, Ror2 and GM130 antibodies and PGCs migrating through the dorsal mesentery (A–A′) were examined (arrowheads). Viewed in the xy plane from above, as well as xz and yz cross sections (top and sides of panels) Ror2 and Stella distribution appeared asymmetric in most WT PGCs at this stage (asterisk, in B, B′, C, C′), and both signals were on the same side of the cell as GM130 (B″, C″). SSEA1 staining was not similarly asymmetric on PGCs (D, D′), nor was membrane-associated β-catenin (D″). On Ror2Y324C PGCs, Ror2 signal was very weak, and did not appear polarized, nor did Stella (E–E′), despite the presence of asymmetric GM130 (E″, arrowhead).
Figure 7
Figure 7. Reduced elongation of migratory Ror2Y324C PGCs in vivo.
(A) WT migratory PGC stained with SSEA1 (green) and DAPI (grey) shown in five sections at different levels through a confocal stack. The axes are measured (blue lines) in the largest plane of the cell, shown in the middle panel, resulting in an EI = 0.23. (B) A confocal stack from a WT e10.25 embryo section stained with SSEA1 and E-cadherin to delineate the hindgut (left). Autofluorescent erythrocytes are present in the lower right quadrant. Filopodia and lamellopodia can be seen on many PGCs; the cell in (A) is boxed. (C) A similar histologic section from a Ror2Y324C embryo posterior, showing several SSEA1+ PGCs in the dorsal mesentery, many of which appear rounded. The boxed PGC is represented in (D), where measurement of the long and short axis in a plane yields an EI = 0.01. (E) Accumulated measurements for EIs of migratory WT and Ror2 mutant PGCs from e9.75–10.75 histologic sections. Postmigratory WT e10.75 (“Gonadal”) PGCs are shown at right in grey and the mean EI in red.

Similar articles

Cited by

References

    1. McLaren A. Primordial germ cells in the mouse. Dev Biol. 2003;262:1–15. - PubMed
    1. Runyan C, Schaible K, Molyneaux K, Wang Z, Levin L, et al. Steel factor controls midline cell death of primordial germ cells and is essential for their normal proliferation and migration. Development. 2006;133:4861–4869. - PubMed
    1. Stevens LC. Origin of testicular teratomas from primordial germ cells in mice. J Natl Cancer Inst. 1967;38:549–552. - PubMed
    1. Stevens LC. Germ cell origin of testicular and ovarian teratomas. Transplant Proc. 1984;16:502–504. - PubMed
    1. Green JL, Kuntz SG, Sternberg PW. Ror receptor tyrosine kinases: orphans no more. Trends Cell Biol. 2008;18:536–544. - PMC - PubMed

Publication types