Molecular cloning and expression analysis of fushi tarazu factor 1 in the brain of air-breathing catfish, Clarias gariepinus
- PMID: 22216130
- PMCID: PMC3247217
- DOI: 10.1371/journal.pone.0028867
Molecular cloning and expression analysis of fushi tarazu factor 1 in the brain of air-breathing catfish, Clarias gariepinus
Abstract
Background: Fushi tarazu factor 1 (FTZ-F1) encodes an orphan nuclear receptor belonging to the nuclear receptor family 5A (NR5A) which includes adrenal 4-binding protein or steroidogenic factor-1 (Ad4BP/SF-1) and liver receptor homologue 1 (LRH-1) and plays a pivotal role in the regulation of aromatases.
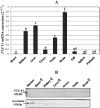
Methodology/principal findings: Present study was aimed to understand the importance of FTZ-F1 in relation to brain aromatase (cyp19a1b) during development, recrudescence and after human chorionic gonadotropin (hCG) induction. Initially, we cloned FTZ-F1 from the brain of air-breathing catfish, Clarias gariepinus through degenerate primer RT-PCR and RACE. Its sequence analysis revealed high homology with other NR5A1 group members Ad4BP/SF-1 and LRH-1, and also analogous to the spatial expression pattern of the latter. In order to draw functional correlation of cyp19a1b and FTZ-F1, we analyzed the expression pattern of the latter in brain during gonadal ontogeny, which revealed early expression during gonadal differentiation. The tissue distribution both at transcript and protein levels revealed its prominent expression in brain along with liver, kidney and testis. The expression pattern of brain FTZ-F1 during reproductive cycle and after hCG induction, in vivo was analogous to that of cyp19a1b shown in our earlier study indicating its involvement in recrudescence.
Conclusions/significance: Based on our previous results on cyp19a1b and the present data, it is plausible to implicate potential roles for brain FTZ-F1 in ovarian differentiation and recrudescence process probably through regulation of cyp19a1b in teleosts. Nevertheless, these interactions would require primary coordinated response from ovarian aromatase and its related transcription factors.
© 2011 Sridevi et al.
Conflict of interest statement
Figures


Similar articles
-
FTZ-F1 and FOXL2 up-regulate catfish brain aromatase gene transcription by specific binding to the promoter motifs.Biochim Biophys Acta. 2012 Jan;1819(1):57-66. doi: 10.1016/j.bbagrm.2011.10.003. Epub 2011 Oct 14. Biochim Biophys Acta. 2012. PMID: 22019437
-
Molecular cloning and expression of the SF-1/Ad4BP gene in the frog, Rana rugosa.Gene. 1998 Nov 19;222(2):169-76. doi: 10.1016/s0378-1119(98)00498-3. Gene. 1998. PMID: 9831646
-
cDNA cloning and mRNA expression of a FTZ-F1 homologue from the pituitary of the orange-spotted grouper, epinephelus coioides.J Exp Zool A Comp Exp Biol. 2004 Aug 1;301(8):691-9. doi: 10.1002/jez.a.74. J Exp Zool A Comp Exp Biol. 2004. PMID: 15286949
-
Human Ad4BP/SF-1 and its related nuclear receptor.J Steroid Biochem Mol Biol. 1999 Apr-Jun;69(1-6):323-8. doi: 10.1016/s0960-0760(99)00081-3. J Steroid Biochem Mol Biol. 1999. PMID: 10419009 Review.
-
Zebrafish sex determination and differentiation: involvement of FTZ-F1 genes.Reprod Biol Endocrinol. 2005 Nov 10;3:63. doi: 10.1186/1477-7827-3-63. Reprod Biol Endocrinol. 2005. PMID: 16281973 Free PMC article. Review.
Cited by
-
Molecular cloning and sexually dimorphic expression patterns of nr0b1 and nr5a2 in olive flounder, Paralichthys olivaceus.Dev Genes Evol. 2015 Apr;225(2):95-104. doi: 10.1007/s00427-015-0495-2. Epub 2015 Mar 11. Dev Genes Evol. 2015. PMID: 25758177
References
-
- Lavorgna G, Ueda H, Clos J, Wu C. FTZ-F1, a steroid hormone receptor-like protein implicated in the activation of fushi tarazu. Science. 1991;252:848–851. - PubMed
-
- Honda S, Morohashi K, Nomura M, Takeya H, Kitajima M, Omura T. Ad4BP regulating steroidogenic P-450 gene is a member of steroid hormone receptor superfamily. J Biol Chem. 1993;268:7494–7502. - PubMed
-
- Yoshiura Y, Senthilkumaran B, Watanabe M, Oba Y, Kobayashi T, Nagahama Y. Synergistic expression of Ad4BP/SF-1 and cytochrome P-450 aromatase (ovarian type) in the ovary of Nile tilapia, Oreochromis niloticus, during vitellogenesis suggests transcriptional interaction. Biol Reprod. 2003;68:1545–1553. - PubMed
Publication types
MeSH terms
Substances
LinkOut - more resources
Full Text Sources

