. 2011;6(12):e29057.
doi: 10.1371/journal.pone.0029057. Epub 2011 Dec 27.

Who needs microtubules? Myogenic reorganization of MTOC, Golgi complex and ER exit sites persists despite lack of normal microtubule tracks

Affiliations

Who needs microtubules? Myogenic reorganization of MTOC, Golgi complex and ER exit sites persists despite lack of normal microtubule tracks

Kristien J M Zaal et al. PLoS One. 2011.

Abstract

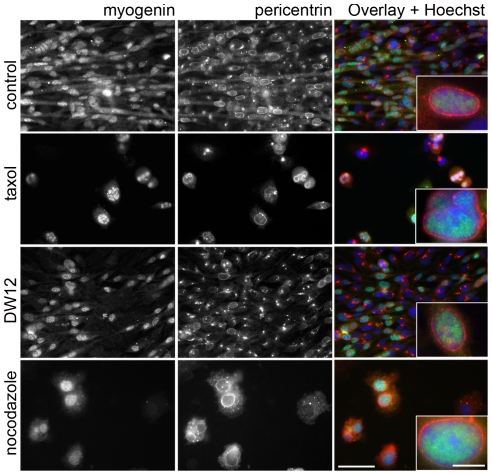
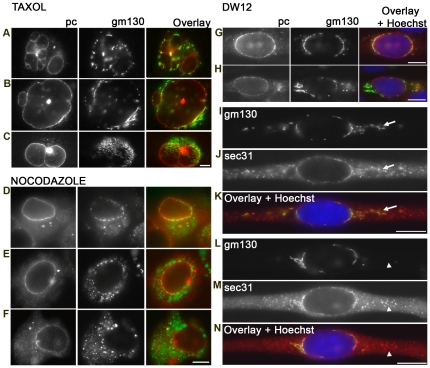
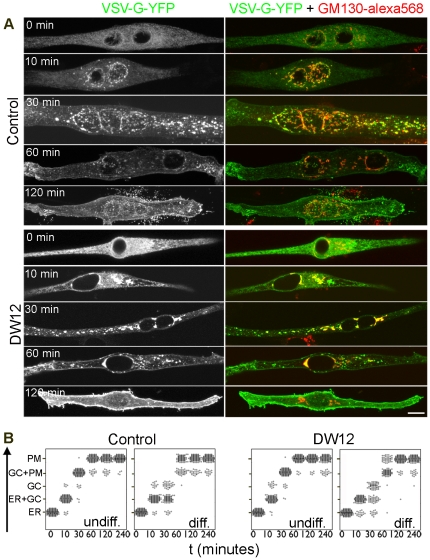
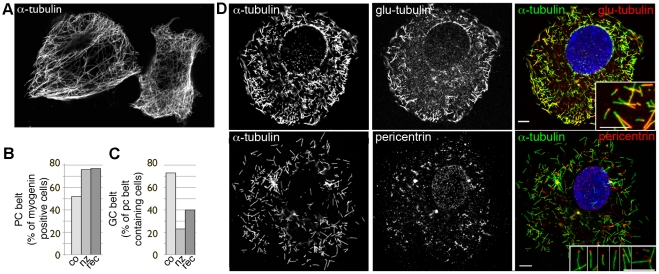
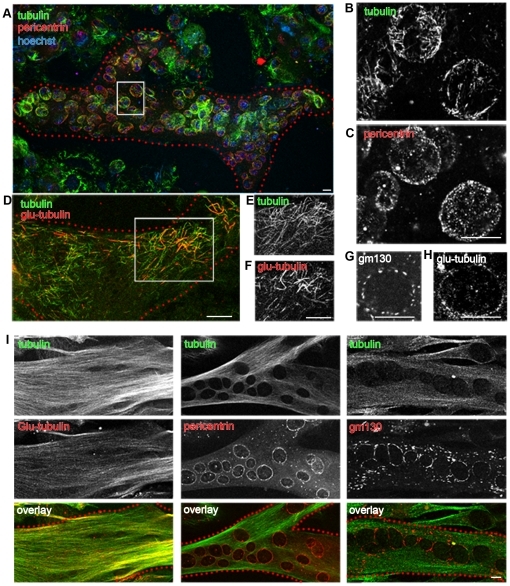
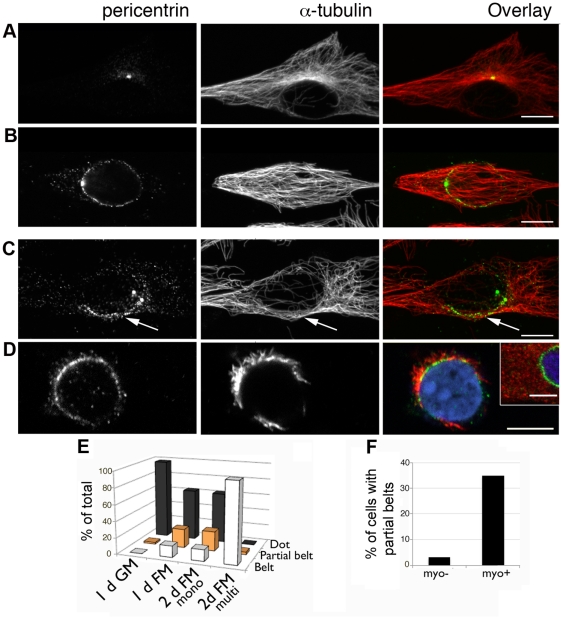
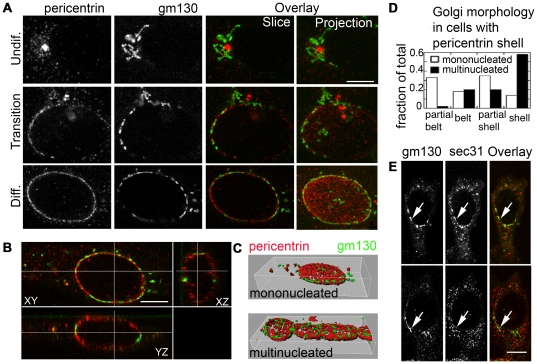
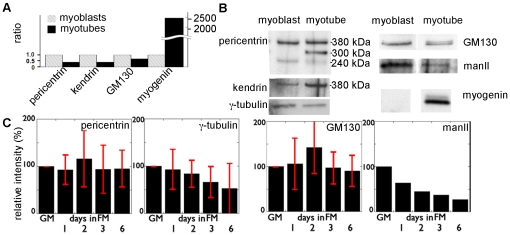
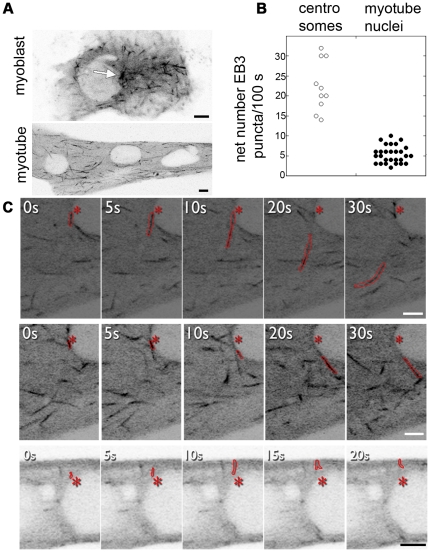
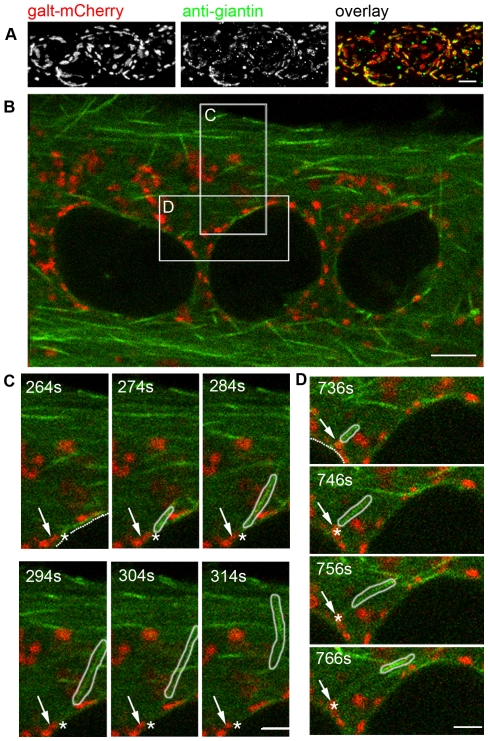
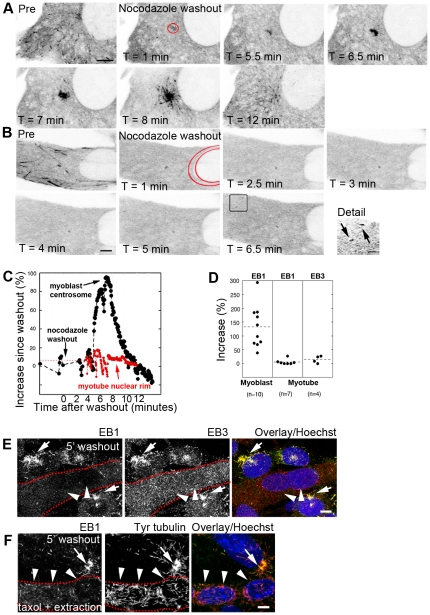
A wave of structural reorganization involving centrosomes, microtubules, Golgi complex and ER exit sites takes place early during skeletal muscle differentiation and completely remodels the secretory pathway. The mechanism of these changes and their functional implications are still poorly understood, in large part because all changes occur seemingly simultaneously. In an effort to uncouple the reorganizations, we have used taxol, nocodazole, and the specific GSK3-β inhibitor DW12, to disrupt the dynamic microtubule network of differentiating cultures of the mouse skeletal muscle cell line C2. Despite strong effects on microtubules, cell shape and cell fusion, none of the treatments prevented early differentiation. Redistribution of centrosomal proteins, conditional on differentiation, was in fact increased by taxol and nocodazole and normal in DW12. Redistributions of Golgi complex and ER exit sites were incomplete but remained tightly linked under all circumstances, and conditional on centrosomal reorganization. We were therefore able to uncouple microtubule reorganization from the other events and to determine that centrosomal proteins lead the reorganization hierarchy. In addition, we have gained new insight into structural and functional aspects of the reorganization of microtubule nucleation during myogenesis.


Conflict of interest statement

Competing Interests: The authors have declared that no competing interests exist.

Figures

Figure 1
Figure 1. C2 cells initiate differentiation and reorganize pericentrin despite chronic treatment with microtubule-disrupting drugs.
Cells differentiated in the presence of 50 nM taxol, 100 nM DW12 or 200 ng/ml nocodazole (see Methods) were stained for myogenin (green), a differentiation marker, and pericentrin (red), a centrosomal protein. Myogenin-positive cells show characteristic perinuclear pericentrin belts (insets) despite incomplete elongation, inhibition of fusion and enlarged nuclei (taxol and nocodazole). Wide-field images. Bars: 25 µm and 5 µm (insets).
Figure 2
Figure 2. Reorganization of Golgi complex and ERES also takes place in cells treated with microtubule-altering drugs.
(A–H) C2 cultures treated as described in Figure 1 were stained for pericentrin (pc, red) and GM130 (green) or (I–N) for GM130 (green) and Sec31 (red), an ERES marker. Only cells with redistributed pericentrin are shown here. In the absence of pericentrin redistribution there is no redistribution of GM130 or Sec31 (not shown here). In taxol- and nocodazole-treated cells, we find different degrees of Golgi complex reorganization: full (A, D); partial (B, E); none (C, F). In DW12 (G–N), Golgi fragment localization is polarized (G, H) or fragmentation is incomplete (H). Most ERES are associated with Golgi complex elements regardless of treatments (I–K; arrows). Rare cytosolic ERES clusters without Golgi elements are observed in the cytoplasm (L–N, arrowheads). Wide-field images. Bars: 20 µm.
Figure 3
Figure 3. Mislocalized Golgi complex supports normal cargo trafficking.
Control and DW12-treated cells were transfected with cDNA for VSV-G-ts045-YFP, held at 40°C to keep VSV-G in the ER and switched to 32°C to allow cargo trafficking to the plasma membrane through the Golgi complex. (A) Differentiated cells fixed at the indicated time after switching to 32°C were stained with anti-GM130 (red) while VSV-G is shown in green. Each image is the projection of a confocal z-stack; DW12 treatment does not affect the timing or pattern of cargo transport. Bar: 20 µm. (B) Quantitation of cargo locations. For each time point, the location of VSV-G-ts045-YFP was determined in 100 cells (represented by dots). In differentiated cells, DW12 delays cargo clearance from the Golgi complex slightly, but cargo eventually reaches the plasma membrane in control and DW12 cells alike.
Figure 4
Figure 4. Fast but abnormal recovery of microtubules in cells kept in nocodazole 72 hours through differentiation.
After three minutes washout from chronic nocodazole treatment (A), there are abundant microtubules but their pattern is different from that in either myoblasts or myocytes. Quantitation of the redistribution of pericentrin (B) and Golgi complex (C) after recovery (co: control; nz: no recovery; rec: 6 hours recovery). Pericentrin redistribution is unchanged, while Golgi complex organization is improved but does not reach the level observed in control cells. Without washout (D), there are residual short microtubules, many of which contain Glu-tubulin (upper row, with inset). Pericentrin (lower row) is found around the nuclear envelope and in the cytoplasm. The selected cell, which has distinct, albeit very little relocation of pericentrin, also has a cytoplasmic pericentrin pool that consists of a few strongly stained dots at the center of microtubule asters and of many small dots that decorate one end of the short microtubules (inset). Nuclei are counterstained with Hoechst (blue). Main panels: confocal z-stack projections; inserts: individual optical sections. Bars: 5 µm.
Figure 5
Figure 5. Full recovery of microtubules in cells kept in nocodazole 72 hours after differentiation.
Cells were differentiated into myotubes and only then treated with 200 ng/ml nocodazole for 72 hours. At the end of the treatment (A–H), myotubes (outlined in red dotted lines) have lost their elongated shape (A, D) and only contain short microtubules located along the nuclear membranes (B), and in the cell periphery (E). Many of the microtubules contain Glu-tubulin (F). Glu-tubulin is also found in dots along the nuclear envelope (H). Pericentrin (C) and Golgi elements (G) remain localized around the myotube nuclei. Panels (B) and (C) show details from the boxed area in (A); (E) and (F) show details from the boxed area in (D). After 24 hours washout from nocodazole, myotubes are elongated again and have re-established a normal microtubule network (I). Staining patterns for Glu-tubulin (left), pericentrin (middle) or GM130 (right) are undistinguishable from those in untreated myotubes. Images are single confocal optical sections. Bars: 10 µm.
Figure 6
Figure 6. Pericentrin reorganization to the nuclear envelope is gradual.
After one day in FM, C2 cultures contain: (A) undifferentiated cells; (B) myocytes with a small pericentrin dot attached to a perinuclear pericentrin belt and longitudinal microtubules; (C) myocytes with a partial pericentrin belt (arrows) and partially remodeled microtubule network. (D) In such cells, microtubule regrowth after complete depolymerization (inset) originates from the partial pericentrin belt. Images are single confocal sections for pericentrin (green) and z-stack projections for tubulin (red). Nuclei are counterstained with Hoechst (blue). Bars: 10 µm; inset: 5 µm. (E) Quantitation of pericentrin morphologies in differentiating cultures and (F) correlation between myogenin expression and pericentrin distribution.
Figure 7
Figure 7. Pericentrin and GM130 reorganize coordinately but occupy distinct domains.
(A) During the transition to the differentiated phenotype, GM130 and pericentrin show a similar degree of partial reorganization. (B) Orthogonal views of a myocyte show a full pericentrin shell around the nucleus while GM130 is limited to the equatorial plane. (C) 3D rendering of pericentrin and GM130 in a myocyte (top) and a myotube (bottom). (D) Quantitation of Golgi complex phenotypes in cells with pericentrin shells. (E) ERES clearly clustered at the nuclear envelope (top row), are colocalized with Golgi fragments, but Golgi fragments are found equally with or without ERES clusters (bottom row). The images are confocal optical sections, except for the last row in A (projections of confocal z-stacks). Bars: 5 µm.
Figure 8
Figure 8. Centrosomal protein and Golgi complex reorganizations do not involve global mRNA or protein level changes.
(A) RT-qPCR shows decreases in mRNAs for pericentrin, kendrin, and GM130 during differentiation which are very small compared to the increase in myogenin mRNA. (B) Western blot analysis with anti-pericentrin produces two bands in myoblast and three in myotube homogenates, whereas anti-kendrin (or pericentrin B) recognizes one band, stronger in myotubes. In the pericentrin blot we thus identify the 240 kDa band as pericentrin A, and the 380 kDa band as kendrin. We have not identified the 300 kDa band. Individual blots again GM130 show small changes when compared to the increase in myogenin, while α-mannosidase II (manII), which is absent from adult muscle, shows an expected decrease. (C) Immunoblot quantitation: values from three independent experiments were averaged, normalized to those for cells in GM (± s.d) except for mannosidase (done once).
Figure 9
Figure 9. EB3-GFP tracking reveals microtubule nucleation from the nuclear membrane of myotubes at steady-state.
(A) Single frames from time-lapse recordings of EB3-GFP in a myoblast (Movie S1) or in a myotube (Movie S2). The arrow in (A) points to the centrosome. (B) Quantitation: we measured 22.4±6.4 nucleations per 100 seconds for centrosomes (n = 10), and 5.4±2.2 per 100 seconds per nucleus for myotubes (n = 28). (C) Details from a myotube recording showing EB3 puncta (outlined in red) moving away from a nucleus (asterisk marks the initial location of the punctum). Bars: 5 µm.
Figure 10
Figure 10. No obligatory relationship between microtubule nucleation and Golgi complex fragments along the myotube nuclear membrane.
(A) GalT-mCherry colocalizes with the Golgi marker giantin (projection of a confocal z-stack). (B) Single frame from time-lapse recordings of EB3-GFP (green) and GalT-mCherry (red) in a doubly transfected myotube (Movie S3). (C, D) EB3 puncta (outlined in white) moving away from a nucleus (delineated by dotted line). The starting point of the punctum (star) in (C) is near but distinct from a Golgi element (arrow) while in (D) the punctum starts from a Golgi element. Boxes in (A) indicate areas enlarged in C, D. Bars: 5 µm.
Figure 11
Figure 11. Timelapse recordings of EB1- or EB3-GFP highlight differences between myoblasts and myotubes after washout from acute nocodazole treatment.
Myoblasts and myotubes expressing EB1-GFP were imaged before, during, and after treatment with nocodazole (1 hour, 5 µg/ml). (A) In myoblasts, EB1-GFP comets are present before treatment (A, Pre), absent during nocodazole treatment (not shown) and at the start of washout (A, t = 1 min). Over the next several minutes, EB1-GFP accumulates in the centrosomal region (A, t = 5.5–8 min). When the return of EB1-GFP comets throughout the cytosol indicates the restart of steady-state microtubule growth, the level of EB1-GFP at the centrosome returns to its initial value (A, t = 13 min). (B) There is no such increase in the EB1-GFP concentration at myotube nuclear rims, despite the return of EB1-GFP comets in the cytosol at 6.5 minutes (see detail of boxed area), indicating that microtubule growth has commenced. (C) Analysis of the level of EB1-GFP in the areas outlined in red in the images shown in A (black) and B (red). (D) Quantitation of EB1-GFP and EB3-GFP levels after nocodazole washout in myoblast centrosomes and myotube nuclear rims. (E) To exclude that the results in B are due to problems with the GFP-tagged constructs, the same treatment was carried out on untransfected cultures. Five minutes after nocodazole washout, cells were fixed and stained for EB1 and EB3. Again, neither accumulates at myotube nuclear rims (arrowheads), while both are prominent at myoblast centrosomes (arrows). (F) When a microtubule stabilization protocol combining detergent extraction and taxol is used before fixation, only very weak EB1 staining is found near myotube nuclear rims (arrowheads), despite the presence of many short microtubules in this location. Bright staining is present at centrosomal regions (arrows) and on small microtubules in myoblasts' cytoplasm. (E, F: dashed lines outline myotubes). Bars = 5 µM (main panels), 1 µM (detail).

Similar articles

Cited by

References

    1. Tassin AM, Maro B, Bornens M. Fate of microtubule-organizing centers during myogenesis in vitro. J Cell Biol. 1985;100:35–46. - PMC - PubMed
    1. Tassin AM, Paintrand M, Berger EG, Bornens M. The Golgi apparatus remains associated with microtubule organizing centers during myogenesis. J Cell Biol. 1985;101:630–638. - PMC - PubMed
    1. Ralston E. Changes in architecture of the Golgi complex and other subcellular organelles during myogenesis. J Cell Biol. 1993;120:399–409. - PMC - PubMed
    1. Rambourg A, Segretain D, Clermont Y. Tridimensional architecture of the Golgi apparatus in the atrial muscle cell of the rat. Am J Anat. 1984;170:163–179. - PubMed
    1. Cameron DA. The Golgi apparatus in bone and cartilage cells. Clin Orthop Relat Res. 1968;58:191–211. - PubMed

Publication types