. 2011;6(12):e29191.
doi: 10.1371/journal.pone.0029191. Epub 2011 Dec 21.

Heterologous expression of membrane proteins: choosing the appropriate host

Affiliations

Heterologous expression of membrane proteins: choosing the appropriate host

Florent Bernaudat et al. PLoS One. 2011.

Abstract

Background: Membrane proteins are the targets of 50% of drugs, although they only represent 1% of total cellular proteins. The first major bottleneck on the route to their functional and structural characterisation is their overexpression; and simply choosing the right system can involve many months of trial and error. This work is intended as a guide to where to start when faced with heterologous expression of a membrane protein.

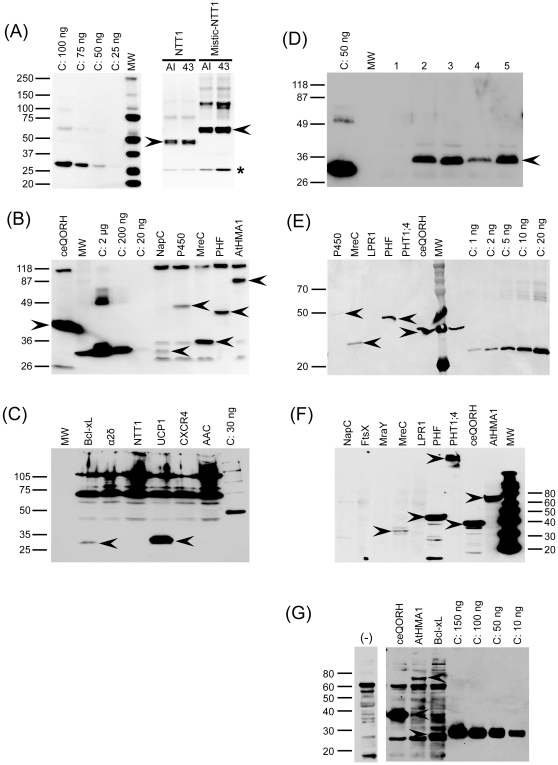
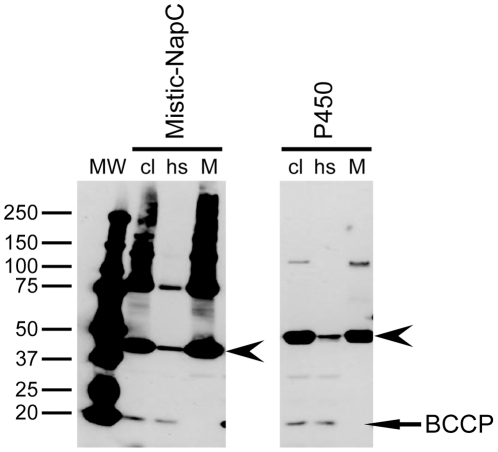
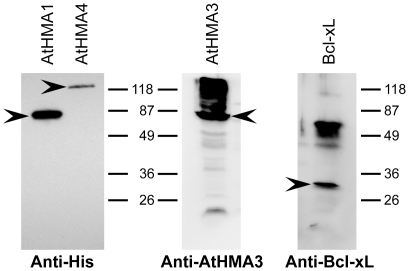
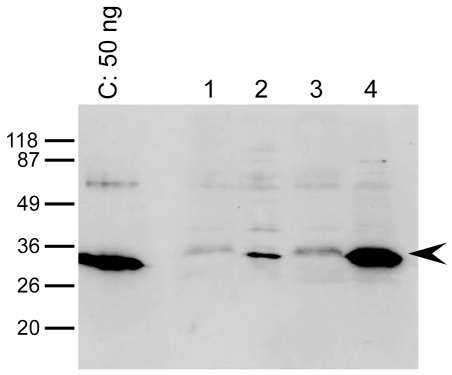
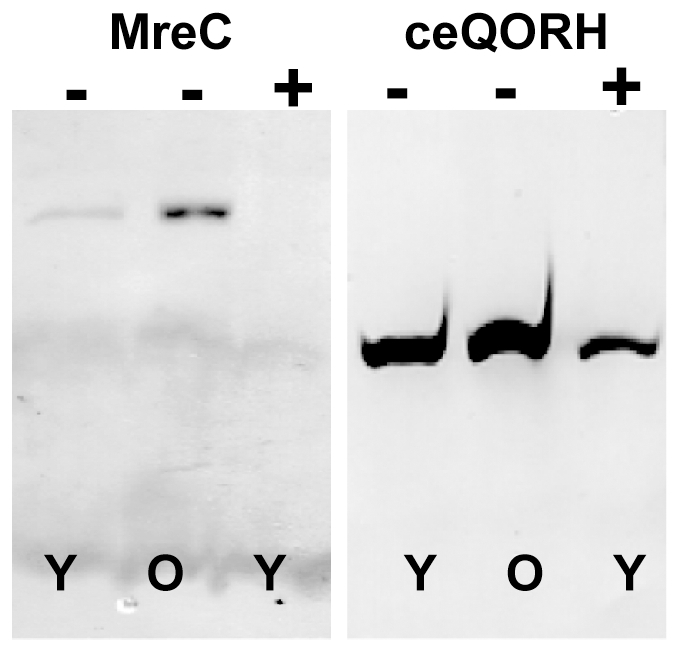
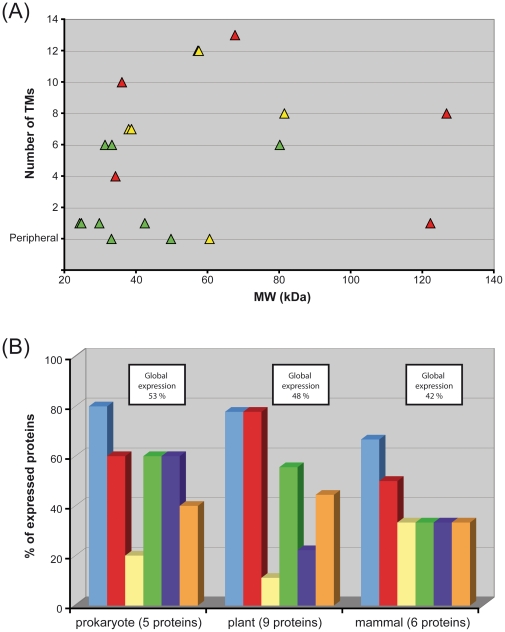
Methodology/principal findings: The expression of 20 membrane proteins, both peripheral and integral, in three prokaryotic (E. coli, L. lactis, R. sphaeroides) and three eukaryotic (A. thaliana, N. benthamiana, Sf9 insect cells) hosts was tested. The proteins tested were of various origins (bacteria, plants and mammals), functions (transporters, receptors, enzymes) and topologies (between 0 and 13 transmembrane segments). The Gateway system was used to clone all 20 genes into appropriate vectors for the hosts to be tested. Culture conditions were optimised for each host, and specific strategies were tested, such as the use of Mistic fusions in E. coli. 17 of the 20 proteins were produced at adequate yields for functional and, in some cases, structural studies. We have formulated general recommendations to assist with choosing an appropriate system based on our observations of protein behaviour in the different hosts.

Conclusions/significance: Most of the methods presented here can be quite easily implemented in other laboratories. The results highlight certain factors that should be considered when selecting an expression host. The decision aide provided should help both newcomers and old-hands to select the best system for their favourite membrane protein.


Conflict of interest statement

Competing Interests: The authors have declared that no competing interests exist.

Figures

Figure 1
Figure 1. Examples of western blot analysis of cell extracts from the different hosts.
(A) Western blot analysis of membrane extracts of E. coli. In this case, the native and Mistic-NTT1 fusion. C: Strep-tag II control protein loaded at 25, 50, 75 or 100 ng. AI: proteins produced in BL21-AI. 43: proteins produced in C43. MW: molecular weight standard. Arrows point out the different target proteins. *: Partly proteolysed NTT1 protein. The membrane was probed with the Strep-Tactin HRP conjugate (IBA). (B) Western Blot analysis of membrane extracts of L. lactis. C: Strep-tag II control protein loaded at 2000, 200 or 20 ng as written above. MW: molecular weight standard. Arrows point out the different target proteins. The membrane was probed with the Strep-Tactin HRP conjugate (IBA). (C) Western blot analysis of membrane extracts of R. sphaeroides. C: Strep-tag II control protein loaded at 30 ng as written above. MW: molecular weight standard. Arrows point out the different target proteins. The membrane was probed with the Strep-Tactin HRP conjugate (IBA). (D) Western blot analysis of membrane extracts of A. thaliana. In this case, the expression of the protein AAC was tested in 5 different transformed plants. The membrane fraction was isolated and the extracts corresponding to the different plants tested (lanes 1 to 5) were analysed. C: Strep-tag II control protein loaded at 50 ng as written above. MW: molecular weight standard. The arrow points out the protein AAC. The membrane was probed with the Strep-Tactin HRP conjugate (IBA). (E) Western blot analysis of membrane extracts of N. benthamiana leaf discs. C: Strep-tag II control protein loaded at 1, 2, 5, 10 or 20 ng as written above. MW: molecular weight marker. Arrows point out the different target proteins. The membrane was probed with the Strep-Tactin HRP conjugate (IBA). (F) Western blot analysis of whole cell extracts of Sf9 insect cells. MW: molecular weight standard. Arrows point out the different target proteins. The membrane was probed with the anti-Strep-Tag II (IBA) and a goat anti mouse–HRP secondary antibody. (G) Western blot analysis of membrane extracts of Sf9 insect cells. This figure is an example of a western-blot for the quantification of target proteins in Sf9 cells membrane vesicles. Here, membrane vesicles of Sf9 cells overproducing either no protein (−), ceQORH, AtHMA1 or Bcl-xL were deposited. C: Strep-tag II control protein loaded at 150, 100, 50, 10 ng as written above. Arrows point out the different target proteins. The membrane was probed with the Anti-Strep-Tag II (IBA) and a goat anti mouse–HRP secondary antibody.
Figure 2
Figure 2. Isolation of the membrane fraction from E. coli cells.
In this case extracts of E. coli cells overexpressing either the Mistic fusion of the protein NapC or the protein P450. cl stands for “cleared lysate” corresponding to the supernatant recovered after centrifugation, at 20,000 g, of the cell lysate. hs and M stand for “high-speed supernatant” and “membrane fraction”, respectively, corresponding to the supernatant and the resuspended pellet recovered after ultra-centrifugation, at 100,000 g, of the “cleared lysate”. Arrows point out the different target proteins and the endogenous E. coli biotinylated protein BCCP. The membrane was probed with the Strep-Tactin HRP conjugate (IBA).
Figure 3
Figure 3. Particular cases of proteins detected in western blots using specific antibodies.
For the detection of AtHMA4 by anti-His antibodies, AtHMA1 was also added on the blot as a positive control. Arrows point out the different target proteins.
Figure 4
Figure 4. Homologous production of AAC in A. thaliana and presence of the recombinant protein in its original organelle, revealed by western blot.
Mitochondria were isolated and enriched, from the leaves of 8 weeks old heterozygous Arabidopsis plants overexpressing the protein AAC, according to two isolation methods described by Keech et al. (lane 2) or by Brugière et al. (lane 4). Lanes 1 & 3 total membrane extracts before the mitochondria isolation treatments. C: Strep-tag II control protein loaded at 50 ng. The arrow points out the protein AAC. The membrane was probed with the Strep-Tactin HRP conjugate (IBA).
Figure 5
Figure 5. Effect of plant age and light intensity on the expression of MreC and ceQORH in N. benthamiana.
The N. benthamiana plants were grown under low light (60–120 µE) or high light (240 µE) before the infiltration with Agrobacterium. The young plants had 4 to 6 leaves whereas the old plants started to blossom. The membranes were then extracted and 6.8 µg of total proteins were loaded on a gel and western-blotted. Y: young plant; O: old plant; (−): light intensity of 60–120 µE; (+): light intensity of 240 µE. The membrane was probed with the Strep-Tactin HRP conjugate (IBA).
Figure 6
Figure 6. Influence of protein properties on expression.
(A) Influence of the protein size and the number of TMs on the expression success rate. The triangles represent each proteins and their colour the success with which they were expressed in the different expression systems. Red = protein expressed in none or only one of the expression systems. Yellow = protein expressed in two or three of the expression systems. Green = protein expressed in four to six of the expression systems. (B) Influence of the origin of proteins on the expression in the different systems. The bars represent the percentage of positively expressed proteins in each expression host for a given category. Light blue: E. coli; Red: L. lactis; Yellow: R. Sphaeroides; Green: A. thaliana; Dark blue: N. benthamiana, Orange: insect cells. Global expression represents the percentage of positively expressed proteins in all expression hosts for a given category.

References

    1. Lacapère J-J, Pebay-Peyroula E, Neumann J-M, Etchebest C. Determining membrane protein structures: still a challenge! Trends Biochem Sci. 2007;32:259–270. doi: 10.1016/j.tibs.2007.04.001. - DOI - PubMed
    1. von Heijne G. The membrane protein universe: what's out there and why bother? J Intern Med. 2007;261:543–557. doi: 10.1111/j.1365-2796.2007.01792.x. - DOI - PubMed
    1. McLuskey K, Roszak AW, Zhu Y, Isaacs NW. Crystal structures of all-alpha type membrane proteins. Eur Biophys J. 2010;39:723–755. doi: 10.1007/s00249-009-0546-6. - DOI - PubMed
    1. Wagner S, Bader ML, Drew D, de Gier J-W. Rationalizing membrane protein overexpression. Trends Biotechnol. 2006;24:364–371. doi: 10.1016/j.tibtech.2006.06.008. - DOI - PubMed
    1. White SH. Biophysical dissection of membrane proteins. Nature. 2009;459:344–346. doi: 10.1038/nature08142. - DOI - PubMed

Publication types