. 2011;6(12):e29354.
doi: 10.1371/journal.pone.0029354. Epub 2011 Dec 27.

Vitamin D3 deficiency differentially affects functional and disease outcomes in the G93A mouse model of amyotrophic lateral sclerosis

Affiliations

Vitamin D3 deficiency differentially affects functional and disease outcomes in the G93A mouse model of amyotrophic lateral sclerosis

Jesse A Solomon et al. PLoS One. 2011.

Abstract

Amyotrophic lateral sclerosis (ALS) is a neuromuscular disease characterized by motor neuron death in the central nervous system. Vitamin D supplementation increases antioxidant activity, reduces inflammation and improves motor neuron survival. We have previously demonstrated that vitamin D(3) supplementation at 10× the adequate intake improves functional outcomes in a mouse model of ALS.

Objective: To determine whether vitamin D deficiency influences functional and disease outcomes in a mouse model of ALS.

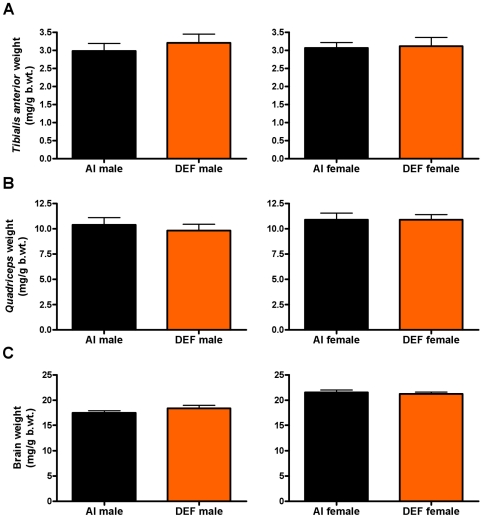
Methods: At age 25 d, 102 G93A mice (56 M, 46 F) were divided into two vitamin D(3) groups: 1) adequate (AI; 1 IU D(3)/g feed) and 2) deficient (DEF; 0.025 IU D(3)/g feed). At age 113 d, tibialis anterior (TA), quadriceps (quads) and brain were harvested from 42 mice (22 M and 20 F), whereas the remaining 60 mice (34 M and 26 F) were followed to endpoint.

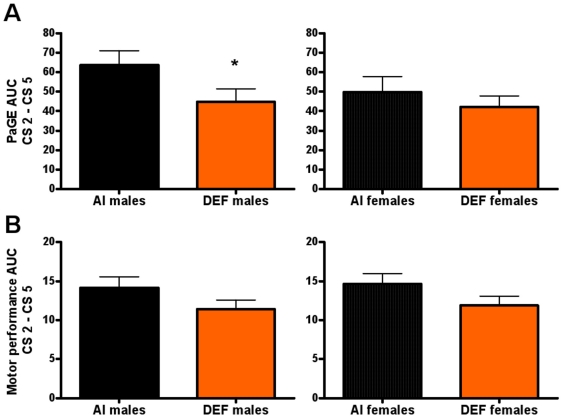
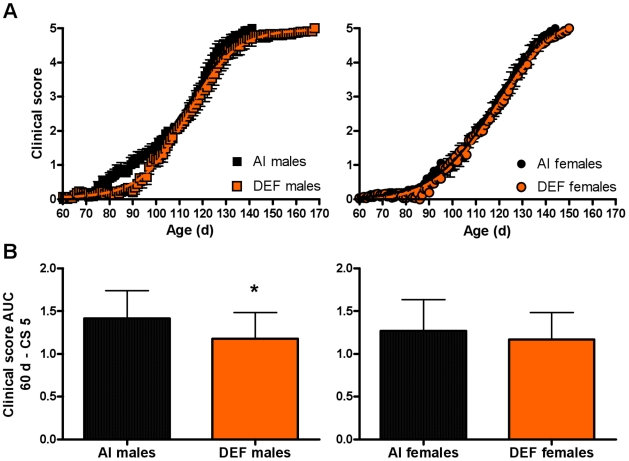
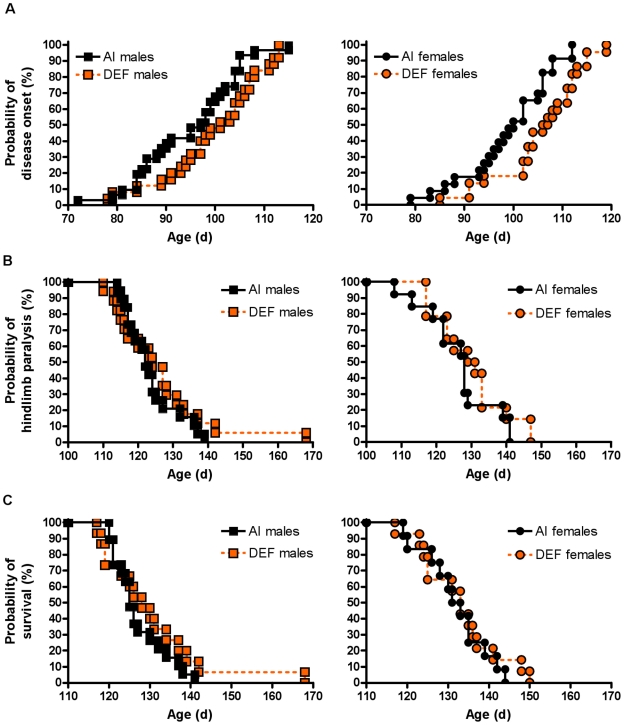
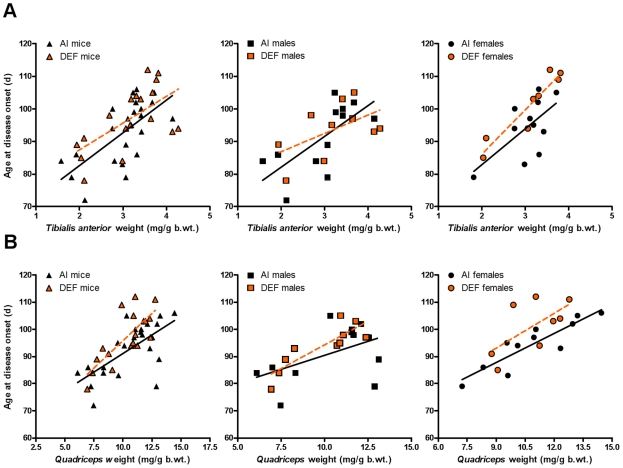
Results: During disease progression, DEF mice had 25% (P=0.022) lower paw grip endurance AUC and 19% (P=0.017) lower motor performance AUC vs. AI mice. Prior to disease onset (CS 2), DEF mice had 36% (P=0.016) lower clinical score (CS) vs. AI mice. DEF mice reached CS 2 six days later vs. AI mice (P=0.004), confirmed by a logrank test which revealed that DEF mice reached CS 2 at a 43% slower rate vs. AI mice (HR= .57; 95% CI: 0.38, 1.74; P=0.002). Body weight-adjusted TA (AI: r=0.662, P=0.001; DEF: r=0.622, P=0.006) and quads (AI: r=0.661, P=0.001; DEF: r=0.768; P<0.001) weights were strongly correlated with age at CS 2.

Conclusion: Vitamin D(3) deficiency improves early disease severity and delays disease onset, but reduces performance in functional outcomes following disease onset, in the high-copy G93A mouse.


Conflict of interest statement

Competing Interests: The authors have declared that no competing interests exist.

Figures

Figure 1
Figure 1. Paw grip endurance and motor performance AUC during disease progression.
(A) Paw grip endurance (PaGE) area under the curve (AUC) between CS 2–CS 5 (i.e. during disease progression) and (B) motor performance AUC between CS 2–CS 5 for 31 adequate vitamin D3 intake (AI; 1 IU D3/g feed; black squares, 19 males; black circles, 12 females) and 29 deficient vitamin D3 intake (DEF; 0.025 IU D3/g feed; orange squares, 15 males; orange circles, 14 females) G93A mice. (A) During disease progression, DEF mice had 25% (P = 0.022) lower PaGE AUC and 23% (P = 0.028) lower cumulative PaGE vs. AI mice, mainly due to DEF males having 30% (P = 0.039) lower PaGE AUC and 28% (P = 0.047) lower cumulative PaGE vs. AI males; DEF females had a non-significant 14% lower PaGE AUC and 13% lower cumulative PaGE vs. AI females. (B) During disease progression, DEF mice had 19% (P = 0.017) lower motor performance AUC and 18% (P = 0.019) lower cumulative motor performance vs. AI mice. DEF males had 19% (P = 0.073) lower motor performance AUC and 18% (P = 0.077) lower cumulative motor performance, as well DEF females had 19% (P = 0.058) lower motor performance AUC and 18% (P = 0.063) lower cumulative motor performance, vs. their AI counterparts during disease progression. Data presented as means ± SEM. * P = 0.039.
Figure 2
Figure 2. Clinical score over time and AUC.
(A) Clinical score (CS) over time and (B) CS area under the curve (AUC) between age 60 d – CS 5 for 31 adequate vitamin D3 intake (AI; 1 IU D3/g feed; black squares, 19 males; black circles, 12 females) and 29 deficient vitamin D3 intake (DEF; 0.025 IU D3/g feed; orange squares, 15 males; orange circles, 14 females) G93A mice. (A) Between age 60–141 d, DEF mice had 12% lower CS vs. AI mice (P = 0.029), mainly due to DEF males having 14% lower CS vs. AI males (P = 0.036). Between age 60–105 d (i.e. prior to disease onset), DEF mice had 36% lower CS vs. AI mice (P = 0.016), mainly due to DEF males having 42% lower CS vs. AI males (P = 0.026); DEF females had a non-significant 19% lower CS vs. AI females. (B) Between age 60 d – CS 5, DEF mice had 14% (P = 0.017) lower CS AUC and 13% (P = 0.016) lower cumulative CS vs. AI mice, mainly due to DEF males having 17% (P = 0.039) lower CS AUC and 16% (P = 0.037) lower cumulative CS vs. AI males. Data presented as means ± SEM.
Figure 3
Figure 3. Correlations of paw grip endurance and motor performance vs. clinical score during disease progression.
(A) PaGE AUC between vs. CS AUC and (B) motor performance AUC vs. CS AUC during disease progression for 31 adequate vitamin D3 intake (AI; 1 IU D3/g feed; black triangles) and 29 deficient vitamin D3 intake (DEF; 0.025 IU D3/g feed; orange triangles) G93A mice. (A) During disease progression, DEF mice (r = 0.213; slope = 14.99; P = 0.268) had a 27% lower PaGE AUC elevation (P = 0.042) for the same CS AUC vs. AI mice (r = −0.026; slope = −3.01; P = 0.891). For AI mice: PaGE AUC CS 2–CS 5 = (66.05±58.23)+[(−3.01±21.82)×(CS AUC CS 2–CS 5)]. For DEF mice: PaGE AUC CS 2–CS 5 = (3.29±35.91)+[(14.99±13.27)×(CS AUC CS 2–CS 5)]. (B) During disease progression, motor performance AUC negatively correlated with CS AUC for both AI (r = −0.359; slope = −7.13; P = 0.047) and DEF (r = −0.404; slope = −5.57; P = 0.030) mice, with DEF mice having 19% lower motor performance elevation vs. AI mice (P = 0.037). For AI mice: motor performance AUC CS 2–CS 5 = (33.29±9.19)+[(−7.13±3.45)×(CS AUC CS 2–CS 5)]. For DEF mice: motor performance AUC CS 2–CS 5 = (26.62±6.56)+[(−5.57±2.42)×(CS AUC CS 2–CS 5)]. Data presented as means ± SEM.
Figure 4
Figure 4. Correlations of motor performance vs. clinical score.
(A) motor performance (s) vs. CS and (B) motor performance vs. CS area under the curve (AUC) for 31 adequate vitamin D3 intake (AI; 1 IU D3/g feed; black squares, 19 males; black circles, 12 females) and 29 deficient vitamin D3 intake (DEF; 0.025 IU D3/g feed; orange squares, 15 males; orange circles, 14 females) G93A mice. (A) DEF mice had 10% lower motor performance corrected for CS vs. AI mice (P = 0.065). (B) DEF mice had 9% lower motor performance AUC corrected for CS vs. AI mice (P = 0.103). Diet differences were driven by DEF females having 11% lower motor performance corrected for CS vs. AI females (P = 0.103). Data presented as means ± SEM.
Figure 5
Figure 5. Probability of disease onset, hindlimb paralysis and survival.
(A) Probability of disease onset (CS 2; %) for 54 adequate vitamin D3 intake (AI; 1 IU D3/g feed; black squares, 31 males; black circles, 23 females) and 47 deficient vitamin D3 intake (DEF; 0.025 IU D3/g feed; orange squares, 25 males; orange circles, 22 females) G93A mice, (B) probability of hindlimb paralysis (CS 4; %) for 32 AI (black squares, 19 males; black circles, 13 females) and 31 DEF (orange squares, 17 males; orange circles, 14 females) G93A mice and (C) probability of survival (CS 5; %) for 31 AI (black squares, 19 males; black circles, 12 females) and 29 DEF (orange squares, 15 males; orange circles, 14 females) G93A mice. (A) DEF mice reached CS 2 at a 43% slower rate vs. AI mice (HR = 0.57; 95% CI: 0.38, 1.74; P = 0.002). DEF males reached CS 2 at a 33% slower rate vs. AI males (HR = 0.67; 95% CI: 0.35, 1.10; P = 0.101). DEF females reached CS 2 at a 50% slower rate vs. AI females (HR = 0.50; 95% CI: 0.21, 0.80; P = 0.009). (B and C) There were no significant diet-based differences in the rate at reaching CS 4 or CS 5.
Figure 6
Figure 6. Body weight-adjusted tibialis anterior, quadriceps and brain weights.
Body weight-adjusted (mg/g b.wt.) (A) tibialis anterior, (B) quadriceps and (C) brain weights for 23 adequate vitamin D3 intake (AI; 1 IU D3/g feed; black squares, 12 males and 11 females) and 19 deficient vitamin D3 intake (DEF; 0.025 IU D3/g feed; orange squares, 10 males and 9 females) G93A mice. (A, B and C) There were no significant diet-based differences in body weight-adjusted tibialis anterior, quadriceps or brain weights. Data presented as means ± SEM.
Figure 7
Figure 7. Correlation of disease onset vs. body weight-adjusted tibialis anterior and quadriceps weights.
Age at disease onset (CS 2; d) vs. body weight-adjusted (mg/g b.wt.) (A) tibialis anterior weight and (B) quadriceps weight for 23 adequate vitamin D3 intake (AI; 1 IU D3/g feed; black triangles, AI mice; black squares, 12 males; black circles, 11 females) and 18 deficient vitamin D3 intake (DEF; 0.025 IU D3/g feed; orange triangles, DEF mice; orange squares, 10 males; orange circles, 8 females) G93A mice. (A) Body weight-adjusted tibialis anterior weights positively correlated with age at CS 2 for AI (r = 0.662; slope = 10.05; P = 0.001) and DEF mice (r = 0.622; slope = 8.21; P = 0.006). DEF females had a 7% delay in reaching disease onset corrected for TA weight (P = 0.045) vs. AI females. For AI mice: Age at CS 2 (d) = (62.47±7.67)+[(10.05±2.49)×(tibialis anterior weight (mg/g b.wt.))]. For DEF mice: Age at CS 2 (d) = (70.96±8.37)+[(8.21±2.58)×(tibialis anterior weight (mg/g b.wt.))]. (B) Body weight-adjusted quadriceps weights positively correlated with age at CS 2 for AI (r = 0.661; slope = 2.74; P = 0.001) and DEF (r = 0.768; slope = 4.02; P<0.001) mice; DEF mice had a 6% delay in reaching disease onset corrected for quads weight (P = 0.024) vs. AI mice. For AI mice: Age at CS 2 (d) = (63.74±7.36)+[(2.74±0.68)×(quadriceps weight (mg/g b.wt.))]. For DEF mice: Age at CS 2 (d) = (55.57±8.76)+[(4.02±0.84)×(quadriceps weight (mg/g b.wt.))]. Data presented as means ± SEM.
Figure 8
Figure 8. Correlation of group body weight-adjusted brain weights vs. group age at endpoint.
The average group body weight-adjusted brain weights (mg/g b.wt.) for 23 adequate vitamin D3 intake (AI; 1 IU D3/g feed; black squares, 12 males; black circles, 11 females) and 19 deficient vitamin D3 intake (DEF; 0.025 IU D3/g feed; orange squares, 10 males; orange circles, 9 females) vs. the average group age at endpoint (CS 5; d) for 31 AI (19 males and 12 females) and 29 DEF (15 males and 14 females) G93A mice. Body weight-adjusted brain weights positively correlated with age at CS 5 for all mice (r = 0.985; slope = 1.32; P = 0.015). Age at CS 5 (d) = (103.80±3.19)+[(1.32±0.16)×(brain weights (mg/g b.wt.))]. Data presented as means ± SEM.

Similar articles

Cited by

References

    1. Nihei K, McKee AC, Kowall NW. Patterns of neuronal degeneration in the motor cortex of amyotrophic lateral sclerosis patients. Acta Neuropathol. 1993;86:55–64. - PubMed
    1. Zang DW, Cheema SS. Degeneration of corticospinal and bulbospinal systems in the superoxide dismutase 1(G93A) (G1H) transgenic mouse model of familial amyotrophic lateral sclerosis. Neurosci Lett. 2002;332:99–102. - PubMed
    1. Smith MC. Nerve Fibre Degeneration in the Brain in Amyotrophic Lateral Sclerosis. J Neurol Neurosur Ps. 1960;23:269–282. - PMC - PubMed
    1. deCarvalho M, Matias T, Coelho F, Evangelista T, Pinto A, et al. Motor neuron disease presenting with respiratory failure. J Neurol Sci. 1996;139:117–122. - PubMed
    1. Synofzik M, Fernandez-Santiago R, Maetzler W, Schols L, Andersen PM. The human G93A SOD1 phenotype closely resembles sporadic amyotrophic lateral sclerosis. J Neurol Neurosur Ps. 2010;81:764–767. - PubMed

Publication types

Substances