. 2011;6(12):e29504.
doi: 10.1371/journal.pone.0029504. Epub 2011 Dec 21.

Novel patient cell-based HTS assay for identification of small molecules for a lysosomal storage disease

Affiliations

Novel patient cell-based HTS assay for identification of small molecules for a lysosomal storage disease

Haifeng Geng et al. PLoS One. 2011.

Abstract

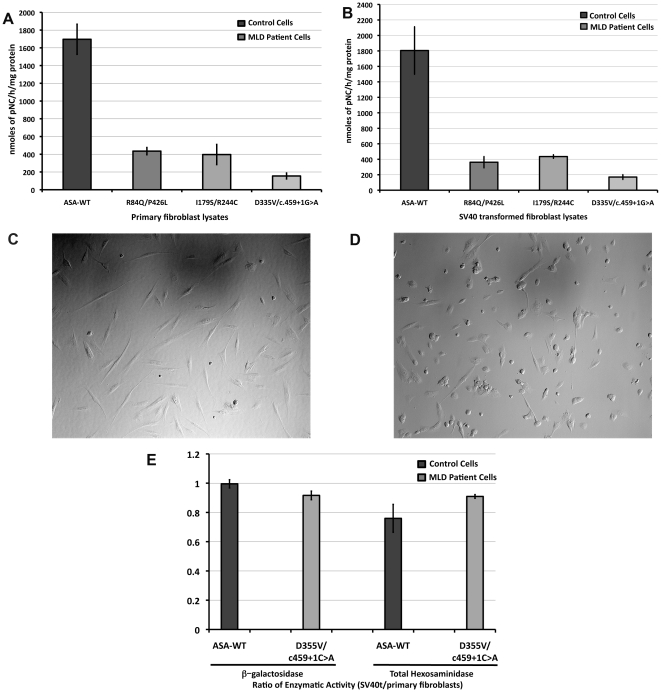
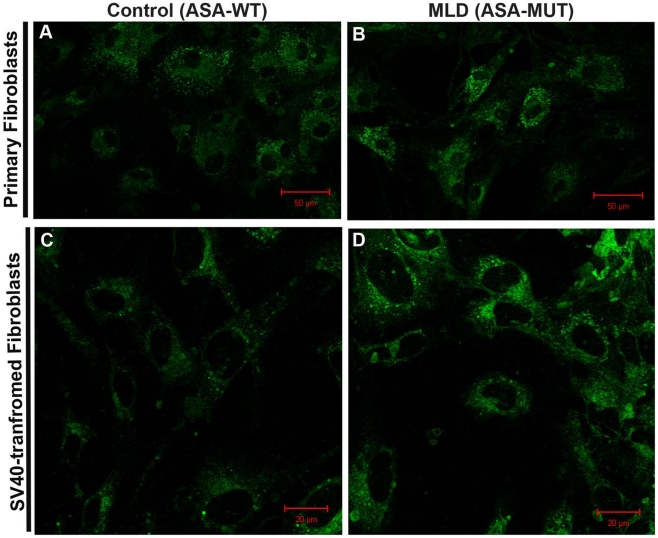
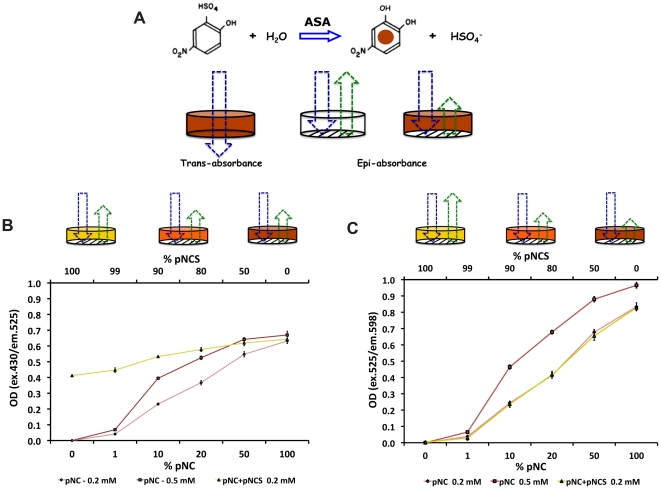
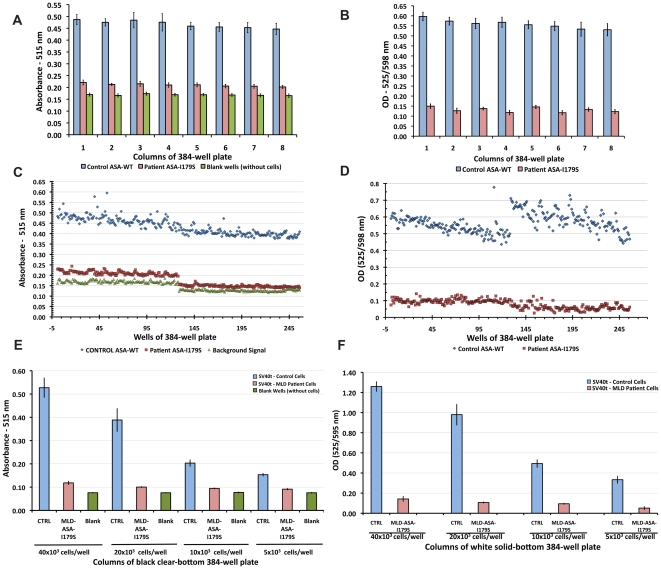
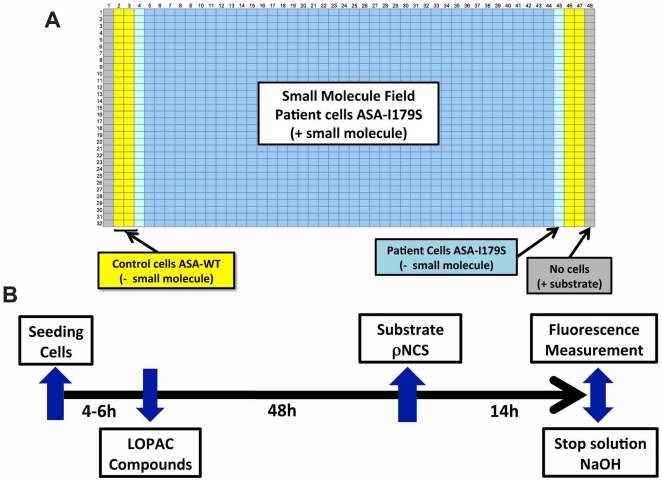
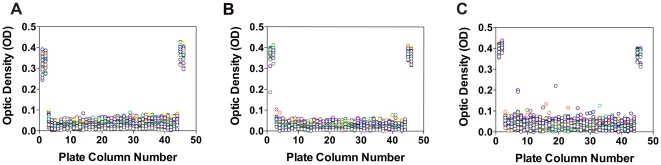
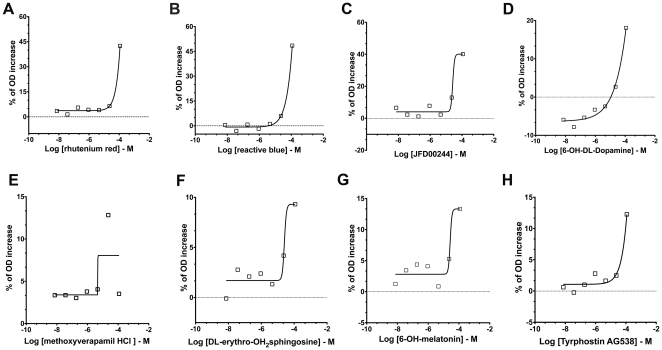
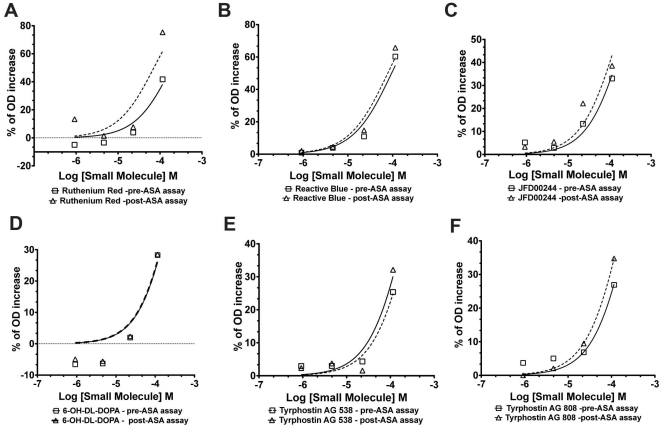
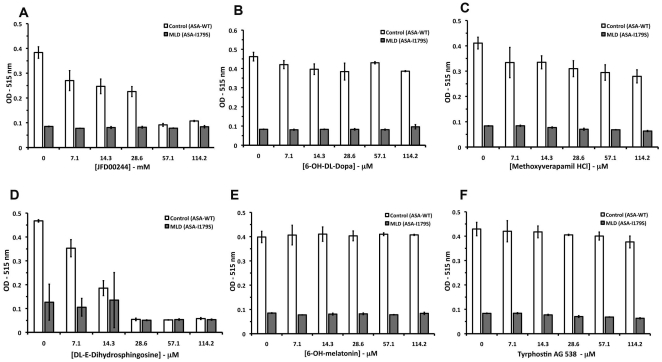
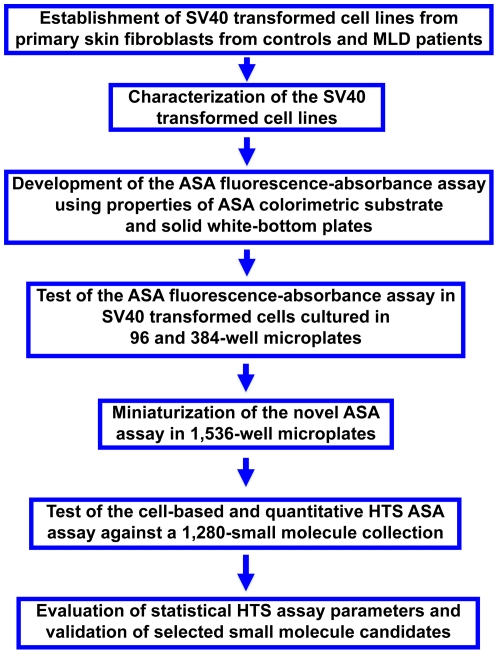
Small molecules have been identified as potential therapeutic agents for lysosomal storage diseases (LSDs), inherited metabolic disorders caused by defects in proteins that result in lysosome dysfunctional. Some small molecules function assisting the folding of mutant misfolded lysosomal enzymes that are otherwise degraded in ER-associated degradation. The ultimate result is the enhancement of the residual enzymatic activity of the deficient enzyme. Most of the high throughput screening (HTS) assays developed to identify these molecules are single-target biochemical assays. Here we describe a cell-based assay using patient cell lines to identify small molecules that enhance the residual arylsulfatase A (ASA) activity found in patients with metachromatic leukodystrophy (MLD), a progressive neurodegenerative LSD. In order to generate sufficient cell lines for a large scale HTS, primary cultured fibroblasts from MLD patients were transformed using SV40 large T antigen. These SV40 transformed (SV40t) cells showed to conserve biochemical characteristics of the primary cells. Using a specific colorimetric substrate para-nitrocatechol sulfate (pNCS), detectable ASA residual activity were observed in primary and SV40t fibroblasts from a MLD patient (ASA-I179S) cultured in multi-well plates. A robust fluorescence ASA assay was developed in high-density 1,536-well plates using the traditional colorimetric pNCS substrate, whose product (pNC) acts as "plate fluorescence quencher" in white solid-bottom plates. The quantitative cell-based HTS assay for ASA generated strong statistical parameters when tested against a diverse small molecule collection. This cell-based assay approach can be used for several other LSDs and genetic disorders, especially those that rely on colorimetric substrates which traditionally present low sensitivity for assay-miniaturization. In addition, the quantitative cell-based HTS assay here developed using patient cells creates an opportunity to identify therapeutic small molecules in a disease-cellular environment where potentially disrupted pathways are exposed and available as targets.


Conflict of interest statement

Competing Interests: The authors have declared that no competing interests exist.

Figures

Figure 1
Figure 1. Biochemical and morphological comparison between primary and transformed cultured skin fibroblasts.
Primary and SV40-transformed (SV40t) skin fibroblasts were culture in 75 cm2 flasks up to confluence before being harvest to obtain cell lysates to perform ASA activity assays. (A) ASA enzymatic activity of primary skin fibroblast, control with wild type ASA (ASA-WT) and three MLD patient cell lines with different ARSA mutations. Each of these cell lines carries a previously described mutant ASA with a residual enzymatic activity (I179S, P426L, D335V). ASA activity is expressed in nmoles of pNC per hour and standardized by protein concentration. (B) ASA activity from SV40t fibroblasts showed comparable ASA activity with primary cell lines. (C) Cell morphology of primary skin fibroblasts showed the classical fusiform shape. The SV40t counterparts (D) show distinguishable polygonal shape. (E) The ratio of enzymatic activity of two other lysosomal enzymes beta-galactosidase and total beta-hexosaminidase are shown. Both the control (ASA-WT; dark gray) and MLD patient cells (ASA-D355V/c.959+1C>A; light gray) showed a ratio close to 1.
Figure 2
Figure 2. NBD-sulfatide assay in primary and SV40 transformed cultured fibroblasts.
Primary and SV40-transformed (SV40t) culture fibroblasts from MLD patient (c.459+1G>A/E484L) were exposed over 24hs to 10 nmoles of albumin-conjugated of NBD-sulfatide (see Methods). The ability of ASA enzymatic activity to degrade the exogenous fluorescent-labeled sulfatide, NBD-sulfatide, can distinguish MLD patient primary fibroblasts (ASA-MUT) (B) from controls (A) with normal ASA-WT enzymatic activity. SV40t fibroblasts from MLD patient (D) also demonstrated elevated accumulation of NBD-sulfatide when compared with SV40t control fibroblasts with normal ASA activity (C).
Figure 3
Figure 3. Development of a fluorescence-quench absorbance assay for ASA using a colorimetric substrate in white solid-bottom 1,536-well plates.
(A) Basis of the fluorescence-quench absorbance assay. The desulfation of pNCS by ASA generates pNC, a colorimetric product, whose optimal absorbance is detectable at 515 nm. Thus, the reaction is performed in clear-bottom (transparent) microplates to measure trans-absorbance. Since white plastic solid-bottom plates have fluorescence properties , when an excitation light is directed to white solid-bottom microplates, emission light can be detected by epi-absorbance (A). The green arrow represents the fluorescence signal emitted from of solid-bottom of the well of a plate. Therefore, the generated pNC product can be used to quench the emission of the light from the bottom of each well in white solid-bottom plates. Based on this principle, the optimal concentrations of pNCS (yellow well) and pNC (brown well) were tested in white solid-bottom 1,536-well plates. Solutions with increasing %concentrations of 0.2 mM (pink lines) and 0,4 mM (red lines) of pNC were used. A pNC+pNCS mixed solution with decreasing %concentrations of 0.2 mM pNCS substrate and increasing %concentrations of 0.2 mM pNC product was used to simulate the effects of ASA over the pNCS substrate. (B) At excitation 430 nm and emission 525 nm (close to pNC absorbance, 515 nm), the pNCS substrate quenches fluorescence from the white solid-bottom plate showing an OD of ∼0.4 at its initial concentration0.2 mM; yellow well with decreased green arrow). Consequently, a flat line with increasing of %concentrations of pNC product was generated (yellow line). (C) However, at excitation 525 nm (close of 515 nm) and emission 598 nm, pNCS no longer quenches the fluorescence from white solid-bottom plate (yellow well with increased green arrow), demonstrating an increasing OD signal with the increase of %pNC (product) and decreased %pNCS (substrate) in the mixed solution of pNCS+pNC. This pNC+pNCS solution (yellow line) overlaps with the solution containing only pNC at 0.2 mM (pink line).
Figure 4
Figure 4. Testing the fluorescence-quench absorbance assay as a throughput assay for ASA activity in cultured cells.
(A) In cultured SV40t fibroblasts from control (ASA-WT) and MLD patient (ASA-I179S), the absorbance ASA assay (515 nm) was tested and showed robust results in black clear-bottom 384-well plates. Each bar corresponds to the mean signal from 16 wells (one plate column). In 384-well white solid-bottom plates, these cultured SV40t fibroblasts showed comparable results were observed (B). Optical density (OD) calculation is described in Methods section. Inter-leaved 384-well plate assays also showed similar results for both ASA absorbance (C) and fluorescence-quench absorbance (D). In a 384-well plate, SV40t fibroblasts from control and a MLD patient were seeded at different numbers per well (E). Using the 15 mM of pNCS substrate concentration in the substrate/lysis buffer, seeding 40×106 cells/well showed the best results of spectrophotometric assays. By reducing the number of cells in each well, 20×106, 10×106 and 5×10⁶, correspondent and equivalent reductions of absorbance signals were observed. (F) The same pattern of results was noted when culturing the same number of cells in a white solid-bottom 384-well plate. However, the optical density (O.D.) measurements read at excitation/emission pair of 525/595 nm from white solid-bottom plate showed improvement in the assay-window between ASA enzymatic activity from SV40t control and MLD patient fibroblasts.
Figure 5
Figure 5. The design of a cell-based HTS assay for ASA in 1,536-well plates.
(A) The disposition of SV40t fibroblasts from MLD patient (ASA-I179S - blue) and from control (ASA-WT - yellow) in a 1,536-well plate. (B) The time-line of events of this cell-based HTS assay for ASA. A library of 1,280 small-molecules at seven different concentrations from 7×10⁻³ to 114.2 microM was used to perform a pilot HTS assay. A total of eight 1,536-well plates in the same format were assayed including one plate with cells treated with DMSO (solvent of compounds) and seven other plates for each of the LOPAC concentration tested.
Figure 6
Figure 6. Scatter plot from the quantitative cell-based HTS assay for ASA using the LOPAC library.
In each panel, columns 2, 3, 46 and 47 depict OD values from wells with control cells (ASA-WT), which were not exposed to small molecules. OD values from MLD patient fibroblasts (ASA-I179S) treated only with DMSO were located in columns 4 and 45. SV40t MLD patient fibroblasts were seeded in columns 5 to 44. The 1,536-well plates treated with DMSO (0.57%) (A), lowest (7×10⁻³; B) and highest (114.2 microM; C) concentrations of LOPAC are shown. Small molecules, demonstrating increased ODs in the plot C, were studied further in the curve analysis.
Figure 7
Figure 7. Concentration-response curve analysis obtained from the quantitative cell-based HTS assay for ASA against LOPAC library.
In the cell-based HTS for ASA using LOPAC concentrations ranging 7×10⁻³ - 114.2 microM, two compounds, ruthenium red (A) and reactive blue (B), showed concentration-response curve of class 2.2 (partial curve; r2≥0.9; efficacy≤80%). Other two small molecules, JFD00244 (C) and 6-OH-DL-Dopamine (D) also presented concentration-response curves of class 2.2. Four small molecules, methoxyverapamil HCl (E), DL-erythro-dihydrosphingosine (F), 6-OH-melatonin (G) and I-Me-Tyrphostin AG 538 (H) showed concentration-response curves of class 2.4 (partial curve; r2≤0.9; efficacy Min. −80%).
Figure 8
Figure 8. Concentration-response curve analysis of HTS assay for ASA to identify fluorescence and colorimetric compounds.
In a 1,536-well plate with the SV40t cultured cells were positioned in the same format as previous assays. LOPAC library was dispensed prior to add substrate/lysis buffer for ASA and after terminating the assay with stop reaction solution. Six compounds depicted in these panels showed increases of the percentage of OD signal (relative to baseline mean of OD value from MLD patient cells). Four highest concentration of LOPAC (0.92, 4.5, 22.8 and 114.2 microM) were used are shown in log scale (in M). Full lines and squares points represent results from the assay in which LOPAC was added just prior to starting ASA assay reaction (pre-ASA assay). Dotted lines and open triangles showed results from the assay in which LOPAC was added after stopping ASA assay reaction (post-ASA assay).
Figure 9
Figure 9. Characterization of candidate compounds in primary culture MLD patient and control cells.
The six compounds with concentration-response curves of classes 2.2 and 2.4 were used to treat primary MLD patient (ASA-I179S) and control cells (ASA-WT). The small molecule concentrations used in this assay were within those used in the primary screening. No significant enhancement of residual ASA-I179S enzymatic activity in MLD patient primary fibroblasts was observed. The small molecules tested where those with concentration-response curve of class 2.2: JFD00244 (A); 6-OH-DL-Dopa (B) and class 2.4: methoxyverapamil HCl (C); DL-E-dihydrosphingosine (D), 6-OH-melatonin (E) and I-Me-Tyrphostin AG 538 (F). Reduction of ASA activity in both controls (ASA-WT) and MLD patient fibroblasts (ASA-I179S) were noted as increased concentrations of JFD00244 (A), DL-E-dihydrosphingosine (D) and methoxyverapamil HCl (C).
Figure 10
Figure 10. Algorithm summarizing the developed patient cell-based HTS assay for ASA.

References

    1. An WF, Tolliday N. Cell-based assays for high-throughput screening. Mol Biotechnol. 2010;45:180–186. - PubMed
    1. Hampton SL, Kinnaird AI. Genetic interventions in mammalian cells; applications and uses in high-throughput screening and drug discovery. Cell Biol Toxicol. 2010;26:43–55. - PubMed
    1. Smid BE, Aerts JM, Boot RG, Linthorst GE, Hollak CE. Pharmacological small molecules for the treatment of lysosomal storage disorders. Expert Opin Investig Drugs. 2010;19:1367–1379. - PubMed
    1. Meikle PJ, Hopwood JJ, Clague AE, Carey WF. Prevalence of lysosomal storage disorders. JAMA. 1999;281:249–254. - PubMed
    1. Grabowski GA, Hopkin RJ. Enzyme therapy for lysosomal storage disease: principles, practice, and prospects. Annu Rev Genomics Hum Genet. 2003;4:403–436. - PubMed

Publication types

Substances