

Comprehensive serum profiling for the discovery of epithelial ovarian cancer biomarkers
- PMID: 22216306
- PMCID: PMC3244467
- DOI: 10.1371/journal.pone.0029533
Comprehensive serum profiling for the discovery of epithelial ovarian cancer biomarkers
Abstract
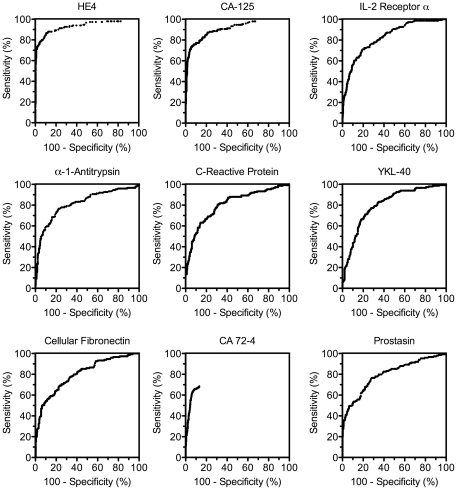
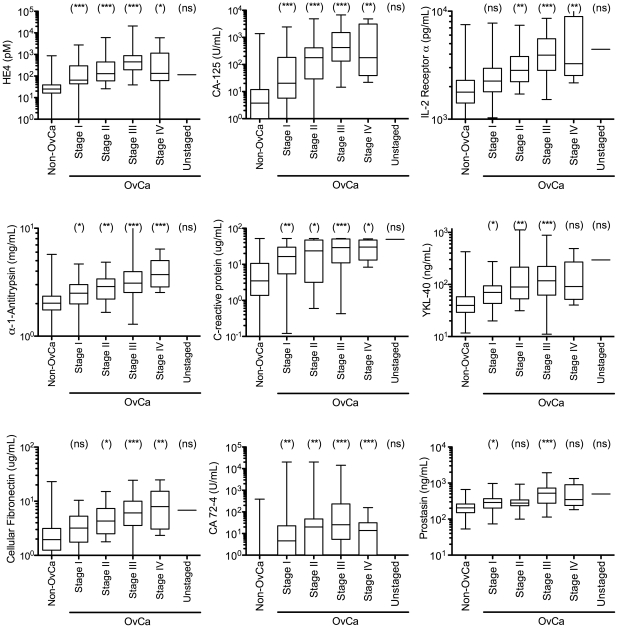
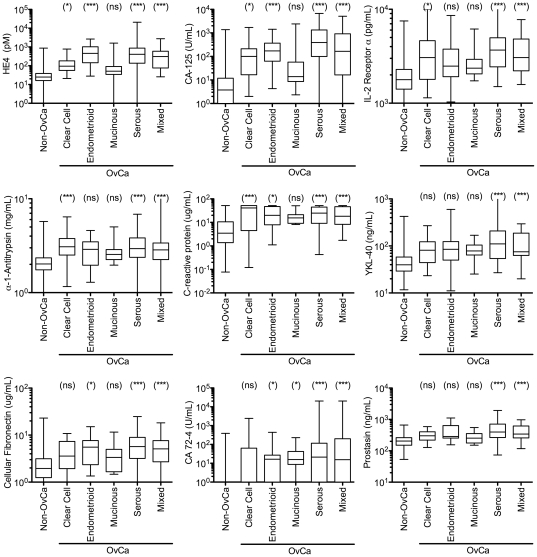
FDA-cleared ovarian cancer biomarkers are limited to CA-125 and HE4 for monitoring and recurrence and OVA1, a multivariate panel consisting of CA-125 and four additional biomarkers, for referring patients to a specialist. Due to relatively poor performance of these tests, more accurate and broadly applicable biomarkers are needed. We evaluated the dysregulation of 259 candidate cancer markers in serum samples from 499 patients. Sera were collected prospectively at 11 monitored sites under a single well-defined protocol. All stages of ovarian cancer and common benign gynecological conditions were represented. To ensure consistency and comparability of biomarker comparisons, all measurements were performed on a single platform, at a single site, using a panel of rigorously calibrated, qualified, high-throughput, multiplexed immunoassays and all analyses were conducted using the same software. Each marker was evaluated independently for its ability to differentiate ovarian cancer from benign conditions. A total of 175 markers were dysregulated in the cancer samples. HE4 (AUC=0.933) and CA-125 (AUC=0.907) were the most informative biomarkers, followed by IL-2 receptor α, α1-antitrypsin, C-reactive protein, YKL-40, cellular fibronectin, CA-72-4 and prostasin (AUC>0.800). To improve the discrimination between cancer and benign conditions, a simple multivariate combination of markers was explored using logistic regression. When combined into a single panel, the nine most informative individual biomarkers yielded an AUC value of 0.950, significantly higher than obtained when combining the markers in the OVA1 panel (AUC 0.912). Additionally, at a threshold sensitivity of 90%, the combination of the top 9 markers gave 88.9% specificity compared to 63.4% specificity for the OVA1 markers. Although a blinded validation study has not yet been performed, these results indicate that alternative biomarker combinations might lead to significant improvements in the detection of ovarian cancer.
© 2011 Yip et al.
Conflict of interest statement
Figures
Similar articles
-
A multiplex biomarker assay improves the diagnostic performance of HE4 and CA125 in ovarian tumor patients.PLoS One. 2020 Oct 19;15(10):e0240418. doi: 10.1371/journal.pone.0240418. eCollection 2020. PLoS One. 2020. PMID: 33075095 Free PMC article.
-
Multianalyte profiling of serum antigens and autoimmune and infectious disease molecules to identify biomarkers dysregulated in epithelial ovarian cancer.Cancer Epidemiol Biomarkers Prev. 2008 Oct;17(10):2872-81. doi: 10.1158/1055-9965.EPI-08-0464. Cancer Epidemiol Biomarkers Prev. 2008. PMID: 18843033
-
A predictive model combining human epididymal protein 4 and radiologic features for the diagnosis of ovarian cancer.Gynecol Oncol. 2014 Mar;132(3):573-7. doi: 10.1016/j.ygyno.2014.01.005. Epub 2014 Jan 10. Gynecol Oncol. 2014. PMID: 24418200
-
New tumor markers: CA125 and beyond.Int J Gynecol Cancer. 2005 Nov-Dec;15 Suppl 3:274-81. doi: 10.1111/j.1525-1438.2005.00441.x. Int J Gynecol Cancer. 2005. PMID: 16343244 Review.
-
HE4 in the differential diagnosis of ovarian masses.Clin Chim Acta. 2015 Jun 15;446:147-55. doi: 10.1016/j.cca.2015.03.047. Epub 2015 Apr 16. Clin Chim Acta. 2015. PMID: 25892674 Review.
Cited by
-
Biomarker-Based Models for Preoperative Assessment of Adnexal Mass: A Multicenter Validation Study.Cancers (Basel). 2022 Mar 31;14(7):1780. doi: 10.3390/cancers14071780. Cancers (Basel). 2022. PMID: 35406551 Free PMC article.
-
The serine protease prostasin (PRSS8) is a potential biomarker for early detection of ovarian cancer.J Ovarian Res. 2016 Mar 31;9:20. doi: 10.1186/s13048-016-0228-9. J Ovarian Res. 2016. PMID: 27036110 Free PMC article.
-
YKL-40 in the diagnosis, prediction of prognosis, and platinum sensitivity in serous epithelial ovarian cancer.Turk J Obstet Gynecol. 2018 Sep;15(3):177-181. doi: 10.4274/tjod.28459. Epub 2018 Sep 3. Turk J Obstet Gynecol. 2018. PMID: 30202628 Free PMC article.
-
Ascites analysis by a microfluidic chip allows tumor-cell profiling.Proc Natl Acad Sci U S A. 2013 Dec 17;110(51):E4978-86. doi: 10.1073/pnas.1315370110. Epub 2013 Dec 2. Proc Natl Acad Sci U S A. 2013. PMID: 24297935 Free PMC article. Clinical Trial.
-
Serum HE4, CA125, YKL-40, bcl-2, cathepsin-L and prediction optimal debulking surgery, response to chemotherapy in ovarian cancer.J Ovarian Res. 2014 Jun 10;7:62. doi: 10.1186/1757-2215-7-62. eCollection 2014. J Ovarian Res. 2014. PMID: 25018782 Free PMC article.
References
-
- American Cancer Society. Atlanta: American Cancer Society; 2010. Cancer Facts and Figures 2010.
-
- Howlader N, Noone AM, Krapcho M, Neyman N, Aminou R, et al. SEER Cancer Statistics Review, 1975-2008. National Cancer Institute Bethesda, MD based on November 2010 SEER data submission, posted to the SEER web site, 2011. 2011.
-
- American Cancer Society. NCCN Ovarian Cancer Treatment Guidelines for Patients. Version III. 2007.
-
- Myers ER, Bastian LA, Havrilesky LJ, Kulasingam SL, Terplan MS, et al. Management of Adnexal Mass. Agency for Healthcare Research and Quality. 130. 2006;130
-
- Timmerman D, Testa AC, Bourne T, Ferrazzi E, Ameye L, et al. Logistic regression model to distinguish between the benign and malignant adnexal mass before surgery: a multicenter study by the International Ovarian Tumor Analysis Group. J Clin Oncol. 2005;23:8794–8801. - PubMed
Publication types
MeSH terms
Substances
Grants and funding
LinkOut - more resources
Full Text Sources
Other Literature Sources
Medical
Research Materials
Miscellaneous
