. 2011;6(12):e29738.
doi: 10.1371/journal.pone.0029738. Epub 2011 Dec 28.

The aging of biomedical research in the United States

Affiliations

The aging of biomedical research in the United States

Kirstin R W Matthews et al. PLoS One. 2011.

Abstract

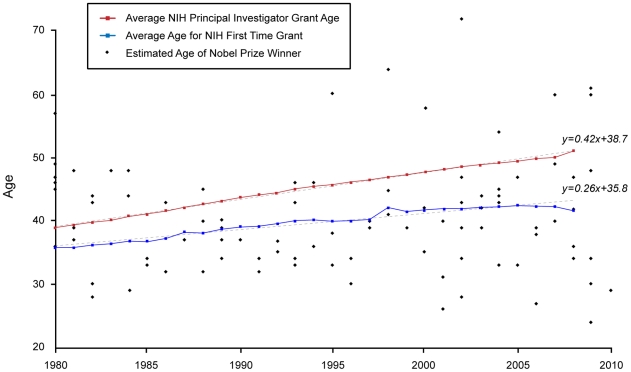
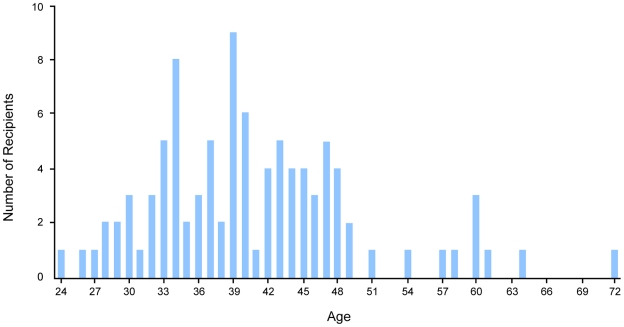
In the past 30 years, the average age of biomedical researchers has steadily increased. The average age of an investigator at the National Institutes of Health (NIH) rose from 39 to 51 between 1980 and 2008. The aging of the biomedical workforce was even more apparent when looking at first-time NIH grantees. The average age of a new investigator was 42 in 2008, compared to 36 in 1980. To determine if the rising barriers at NIH for entry in biomedical research might impact innovative ideas and research, we analyzed the research and publications of Nobel Prize winners from 1980 to 2010 to assess the age at which their pioneering research occurred. We established that in the 30-year period, 96 scientists won the Nobel Prize in medicine or chemistry for work related to biomedicine, and that their groundbreaking research was conducted at an average age of 41-one year younger than the average age of a new investigator at NIH. Furthermore, 78% of the Nobel Prize winners conducted their research before the age of 51, the average age of an NIH principal investigator. This suggested that limited access to NIH might inhibit research potential and novel projects, and could impact biomedicine and the next generation scientists in the United States.


Conflict of interest statement

Competing Interests: The authors have declared that no competing interests exist.

Figures

Figure 1:
Figure 1:. Age Comparison between NIH PIs and First-Time Recipients with Nobel Recipients, 1980- 2010.
Since 1980, the average age of an NIH principal investigator (red) and a first-time grant recipient (blue) has steadily increased. The age of principal investigators is rising faster (with a slope of 0.42, p<.001) than first-time grant recipients (with a slope of 0.26, p<.001). Of the 96 Nobel laureates studied, 55 (57%) published their discoveries at an age under the average age for a first-time NIH grant (blue), and 75 (78%) published before the average age for a NIH grant (red). Ordinary least squares regression of the average age of Nobel prize winners on year of award indicated that there was no statistically significant increase in the age over time (p = 0.42). This suggested that investigators are publishing Nobel-worthy research at a younger age than a first-time NIH grantee or the average principal investigator.
Figure 2:
Figure 2:. Estimated Age Distribution of Biomedicine-related Nobel Recipients, 1980-2010.
The estimated age distribution of the 96 laureates at time of publication of their Nobel Prize research in biomedicine ranged from 24 to 72. The average age of recipients was 41 and the majority (61%) were under the age of 42, indicating that the distribution was not symmetric and was skewed toward younger investigators.
Figure 3:
Figure 3:. Science and Engineering Doctorate Holders Employed in Academia in 2006.
The proportion of full-time faculty (dark shade) was lowest for the life sciences (red) across all science and engineering fields in 2006. The life sciences also had the highest percentage of postdoctoral fellows (lightest shade) across all the fields. This was in contrast to computer science (purple), which had the highest proportion of full-time faculty and lowest proportion of postdoctoral fellows. SOURCE: National Science Foundation, Science and Engineering Indicators 2010.
Figure 4:
Figure 4:. Number of Positions in the Biological Sciences, 1981–2006.
The number of full-time faculty (blue) in the biological sciences has decreased between 1981 and 2006, while the number of postdoctoral fellows (green) has increased, and number of nonfaculty full-time positions (red) has remained relatively steady. Faculty included full-time full, associate, and assistant professors plus instructors. Nonfaculty positions included research associates, adjunct appointments, lecturers, and administrative positions. SOURCE: National Science Foundation, Science and Engineering Indicators 2010.
Figure 5:
Figure 5:. Science and Engineering Postdoctoral Fellows, by Field in 2005.
Biological sciences (lightest shade) represented the overwhelming majority of postdoctoral fellows in 2005 (49.1%) compared to other sciences. SOURCE: National Science Foundation, Science and Engineering Indicators 2010.

References

    1. Obama B. Remarks by the President at the National Academy of Sciences Annual Meeting. Natl Acad of Sci USA. 2009 Available: http://www.whitehouse.gov/the-press-office/remarks-president-national-ac.... Accessed 2011 May 25.
    1. Zerhouni E. Breakfast with Dr. Elias Zerhouni. Baker Inst Public Policy. 2008 Available: http://www.bakerinstitute.org/events/breakfast-with-dr-elias-zerhouni. Accessed 2011 May 25.
    1. NIH New and Early Stage Investigator Policies. 2011;25 Available: http://grants.nih.gov/grants/new_investigators/index.htm and http://grants.nih.gov/grants/new_investigators/resources.htm#data. Accessed 2011 May.
    1. Kaiser J. The Graying of NIH Research. Science 322: 848 -849. 2008 Available: http://www.sciencemag.org/content/322/5903/848.short. Accessed 2011 May 25. - PubMed
    1. The incredible aging investigator. Science 319: 391. 2008 Available: http://www.sciencemag.org/content/319/5862/391.4.short. Accessed 2011 May 25.

Publication types