. 2011;6(12):e29801.
doi: 10.1371/journal.pone.0029801. Epub 2011 Dec 28.

Circadian clocks in mouse and human CD4+ T cells

Affiliations

Circadian clocks in mouse and human CD4+ T cells

Thomas Bollinger et al. PLoS One. 2011.

Abstract

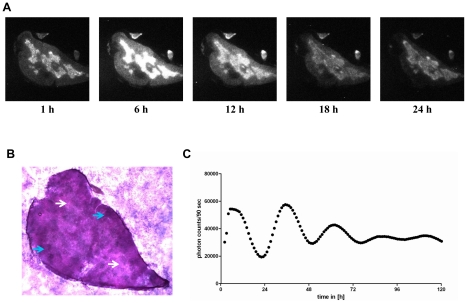
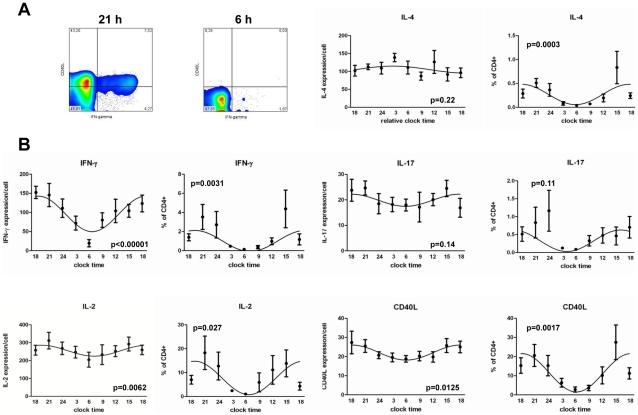
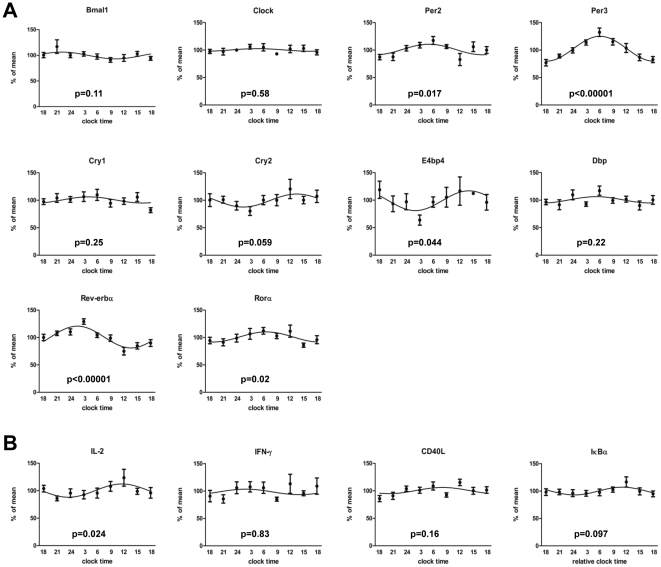
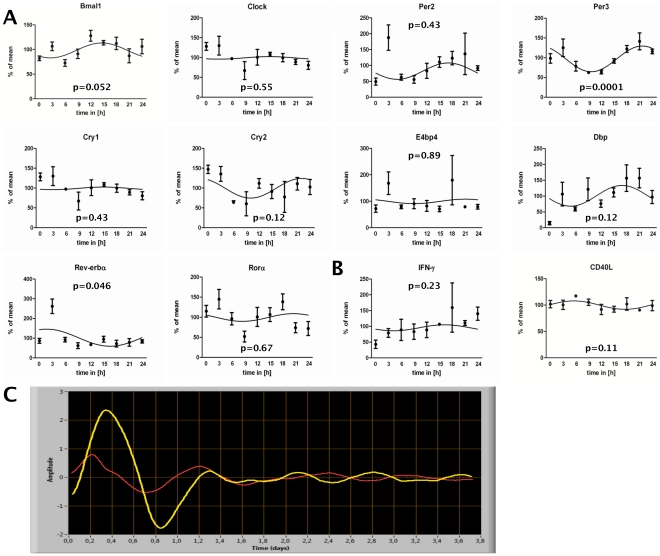
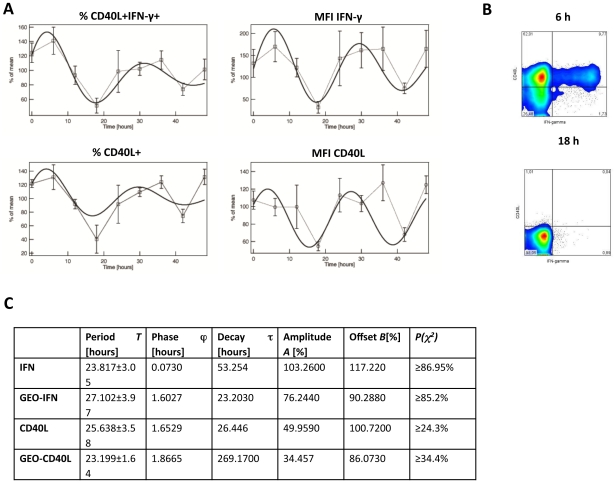
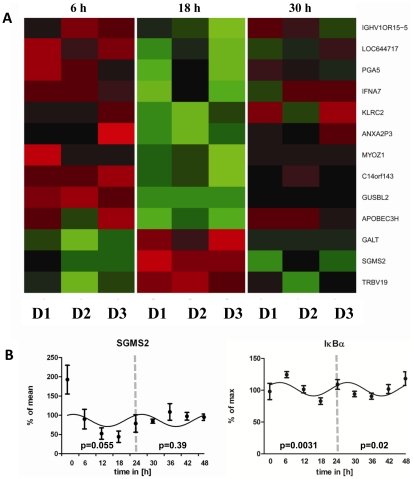
Though it has been shown that immunological functions of CD4+ T cells are time of day-dependent, the underlying molecular mechanisms remain largely obscure. To address the question whether T cells themselves harbor a functional clock driving circadian rhythms of immune function, we analyzed clock gene expression by qPCR in unstimulated CD4+ T cells and immune responses of PMA/ionomycin stimulated CD4+ T cells by FACS analysis purified from blood of healthy subjects at different time points throughout the day. Molecular clock as well as immune function was further analyzed in unstimulated T cells which were cultured in serum-free medium with circadian clock reporter systems. We found robust rhythms of clock gene expression as well as, after stimulation, IL-2, IL-4, IFN-γ production and CD40L expression in freshly isolated CD4+ T cells. Further analysis of IFN-γ and CD40L in cultivated T cells revealed that these parameters remain rhythmic in vitro. Moreover, circadian luciferase reporter activity in CD4+ T cells and in thymic sections from PER2::LUCIFERASE reporter mice suggest that endogenous T cell clock rhythms are self-sustained under constant culture conditions. Microarray analysis of stimulated CD4+ T cell cultures revealed regulation of the NF-κB pathway as a candidate mechanism mediating circadian immune responses. Collectively, these data demonstrate for the first time that CD4+ T cell responses are regulated by an intrinsic cellular circadian oscillator capable of driving rhythmic CD4+ T cell immune responses.


Conflict of interest statement

Competing Interests: The authors have declared that no competing interests exist.

Figures

Figure 1
Figure 1. Bioluminescence microscopy of PER2::LUCIFERASE thymic sections.
Male PER2::LUCIFERASE reporter mice were sacrificed and the thymus lobe was sliced. One section was put into medium (DMEM) supplemented with luciferin and light emission was continuously imaged (10-fold magnification applying the Olympus LV200) over approximately five days at 37°C. A) Depicted are microscopic images in six hour intervals of the first 24 h (the complete microscopic video is in the supplemental material). B) A section of the in A analyzed thymus lobe was stained with haemalaun/eosin to visualize cortex and medulla of the thymus lobe (2.5-fold magnification). White arrows show the medulla (light purple regions) and blue arrows show the cortex (dark purple regions). C) Shows the quantified amount of light emission by the thymic slice over the whole recording time. Shown are data of one out of two experiments (period length = 26 h).
Figure 2
Figure 2. Circadian T cell activity ex vivo.
Blood was sampled from seven healthy young males in three hour intervals starting at 6 PM over a 24 h period. CD4+ T cells were isolated from whole blood by MACS technology and the purified CD4+ T cells (mean purity: 94.99%±0.5%) were stimulated six hours with PMA/ionomycin. Cells were then fixed and CD40L, IL-2, IL-4, IL-17, and IFN-γ expression was analyzed by FACS. A) Shows two FACS plots of one donor at the peak and trough of IFN-γ production (time points as indicated). B) The graphs depict the GeoMean data (expression/cell), the percent of CD40L+ cytokine+ CD4+ T cells and the percent of CD40L+ CD4+ T cells as indicated. The p-values depicted in each graph were calculated by Cosinor analysis (Table. S2).
Figure 3
Figure 3. Circadian clock gene expression in purified CD4+ T cells ex vivo.
Blood was sampled from seven healthy young males in three hours intervals starting at 6 PM over a 24 h period. CD4+ T cells were isolated from whole blood by MACS technology and the purified CD4+ T cells (mean purity: 94.99%±0.5%) were lysed, RNA was isolated, and the mRNA of ten clock genes was analyzed by qPCR. Depicted are the mRNA levels of clock genes (A) and immune genes (B) relative to the reference genes B2M, HPRT, PBGD, and G6PDH. The p-values depicted in each graph were calculated by Cosinor analysis (Table. S2).
Figure 4
Figure 4. Circadian clock gene expression in in vitro cultured CD4+ T cells and PER2::Luciferase CD4+ reporter T cells.
Blood was sampled from three healthy young males at 6 PM. CD4+ T cells were isolated from whole blood by MACS technology and the purified CD4+ T cells (mean purity: 96.4%±1.7%) and subsequently cultured in serum free medium. Every three hours over a 24 h period cells were collected, lysed, RNA was isolated, and clock genes expression analyzed by quantitative RT-PCR. A+B) depict the mRNA expression of clock genes (A) and immune genes (B) relative to the reference genes B2M and HPRT. The x-axis reflects the time cells were in culture. C) CD4+ T cells (purity: spleen = 88%, thymus = 96.7%) were isolated from spleen (red line, period = 24 h) and thymus (yellow line, period = 26.5 h) of Per-Luc reporter mice and cultured in the presence of 0.5 ng/ml PMA. Data shown are from one of five (spleen derived CD4+ T cells) and one out of two (thymus derived CD4+ T cells) independent experiments.
Figure 5
Figure 5. Circadian immune response of stimulated CD4+ T cells in vitro.
Blood was sampled from four healthy young males at 10 AM. CD4+ T cells were isolated from whole blood by MACS technology and the purified CD4+ T cells (mean purity: 91.14%±0.82%) were subsequently cultured in serum-free medium and stimulated with PMA/ionomycin. A) Depicts the expression (GeoMean) as “percent of mean” of IFN-γ (mean = 207.74) and CD40L (mean = 54.56) per cell as well as the “percent of mean” of the percent of CD40L+CD4+(mean = 63.16%) and CD40L+IFN-γ+ CD4+ T cells (mean = 9.8%). The x-axis reflects the time cells were in culture. The statistical analyses of the fitting are shown in the table (C). The p-values calculated by Cosinor analysis are depicted in Table. S2. B) Shows two FACS plots of one donor at the peak and trough of IFN-γ production (time point as indicated).
Figure 6
Figure 6. Circadian microarray and qPCR analysis of stimulated CD4+ T cells in vitro.
Blood was sampled from three healthy young males at 10 AM. CD4+ T cells were isolated from whole blood by MACS technology. Aliquots of purified CD4+ T cells (mean purity: 90.94%±0.46%) were cultured up to 48 h. For microarray analysis aliquots were taken out in 6 h intervals and stimulated. Cells were stimulated 3 h with PMA/ionomycin. At the first and second peak as well as at the first trough of IFN-γ production cells were harvested for microarray analysis to identify candidate genes involved in the circadian regulation of IFN-γ production. A) Heat map of candidate genes identified by ANOVA. B) qPCR was performed from all time points (9 time points over 48 h) for SGMS2 and IκBα. The p-values depicted in each graph were calculated by Cosinor analysis (Table. S2). The x-axis reflects the time cells were in culture. The dashed line splits the first and second 24 h period. P-values were separately calculated for the first and second 24 h and are depicted respectively.

References

    1. Reppert SM, Weaver DR. Coordination of circadian timing in mammals. Nature. 2002;418:935–941. 10.1038/nature00965 [doi];nature00965 [pii] - PubMed
    1. Toh KL, Jones CR, He Y, Eide EJ, Hinz WA, et al. An hPer2 phosphorylation site mutation in familial advanced sleep phase syndrome. Science. 2001;291:1040–1043. - PubMed
    1. Schibler U, Sassone-Corsi P. A web of circadian pacemakers. Cell. 2002;111:919–922. S0092867402012254 [pii] - PubMed
    1. Balsalobre A, Damiola F, Schibler U. A serum shock induces circadian gene expression in mammalian tissue culture cells. Cell. 1998;93:929–937. S0092-8674(00)81199-X [pii] - PubMed
    1. Terazono H, Mutoh T, Yamaguchi S, Kobayashi M, Akiyama M, et al. Adrenergic regulation of clock gene expression in mouse liver. Proc Natl Acad Sci U S A. 2003;100:6795–6800. 10.1073/pnas.0936797100 [doi];0936797100 [pii] - PMC - PubMed

Publication types