Randomized Controlled Trial
. 2012 Jan 4:13:3.
doi: 10.1186/1471-2202-13-3.

Altered networks in bothersome tinnitus: a functional connectivity study

Affiliations
Randomized Controlled Trial

Altered networks in bothersome tinnitus: a functional connectivity study

Harold Burton et al. BMC Neurosci. .

Abstract

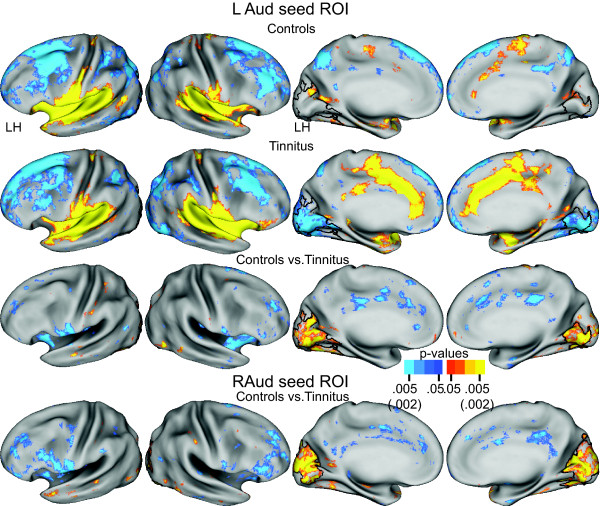
Background: The objective was to examine functional connectivity linked to the auditory system in patients with bothersome tinnitus. Activity was low frequency (< 0.1 Hz), spontaneous blood oxygenation level-dependent (BOLD) responses at rest. The question was whether the experience of chronic bothersome tinnitus induced changes in synaptic efficacy between co-activated components. Functional connectivity for seed regions in auditory, visual, attention, and control networks was computed across all 2 mm(3) brain volumes in 17 patients with moderate-severe bothersome tinnitus (Tinnitus Handicap Index: average 53.5 ± 3.6 (range 38-76)) and 17 age-matched controls.

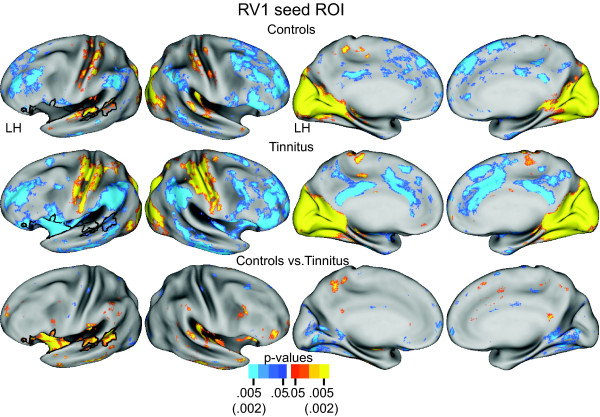
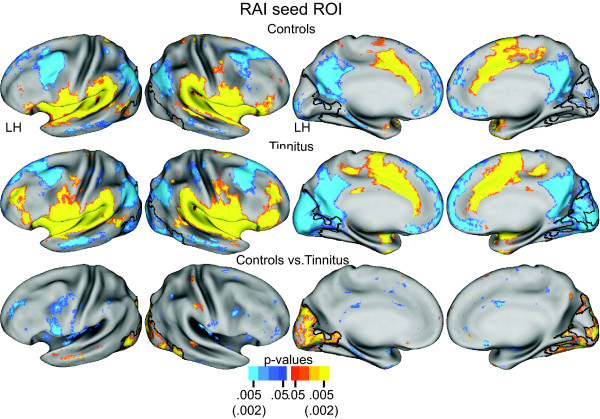
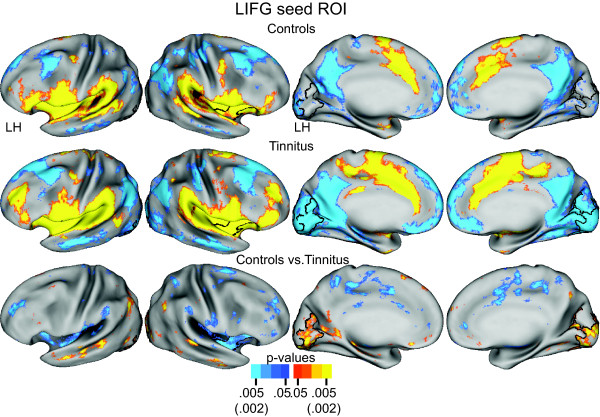
Results: In bothersome tinnitus, negative correlations reciprocally characterized functional connectivity between auditory and occipital/visual cortex. Negative correlations indicate that when BOLD response magnitudes increased in auditory or visual cortex they decreased in the linked visual or auditory cortex, suggesting reciprocally phase reversed activity between functionally connected locations in tinnitus. Both groups showed similar connectivity with positive correlations within the auditory network. Connectivity for primary visual cortex in tinnitus included extensive negative correlations in the ventral attention temporoparietal junction and in the inferior frontal gyrus and rostral insula - executive control network components. Rostral insula and inferior frontal gyrus connectivity in tinnitus also showed greater negative correlations in occipital cortex.

Conclusions: These results imply that in bothersome tinnitus there is dissociation between activity in auditory cortex and visual, attention and control networks. The reciprocal negative correlations in connectivity between these networks might be maladaptive or reflect adaptations to reduce phantom noise salience and conflict with attention to non-auditory tasks.


Figures

Figure 1
Figure 1
Comparison between tinnitus and control participants for mean brain signals and head movements. Scatter plot of standard deviation (STDev) of mean whole-brain signals vs. root-mean square (RMS) of head movements.
Figure 2
Figure 2
Functional connectivity maps for a left primary auditory area (LAud) seed region centered in Heschl's gyrus. Rows 1 and 2 show, respectively, random effect functional connectivity t-maps [62] for controls and tinnitus displayed on inflated views of the PALS-B12 atlas surface [59]. The distribution of positive and negative correlations between time courses in the seed vs. other brain locations painted, respectively, in yellow-orange and blue (scale: p value 0.05-0.005). Row 3 shows map of a t-test assessment per node of group differences in Fisher Z-transforms of correlations. Significant t-test results marked in yellow-orange for positive and blue for negative (scale: p value 0.05-0.002). Row 4 shows t-test results for contrast between functional connectivity maps for a right primary auditory area (RAud) seed region. Black borders surround significant cluster identified with the threshold free cluster extension analysis [63] after 5000 permutations of the t-test analysis and an alpha threshold < .05.
Figure 3
Figure 3
Functional connectivity maps for a seed region in right primary visual area (RV1) centered within the calcarine sulcus. Rows 1 and 2 show, respectively, random effect functional connectivity t-maps [62] for controls and tinnitus displayed on inflated views of the PALS-B12 atlas surface [59]. The distribution of positive and negative correlations between time courses in the seed vs. other brain locations painted, respectively, in yellow-orange and blue (scale: p value 0.05-0.005). Row 3 shows map of a t-test assessment per node of group differences in Fisher Z-transforms of correlations. Significant t-test results marked in yellow-orange for positive and blue for negative (scale: p value 0.05-0.002). Black borders surround significant cluster identified with the threshold free cluster extension analysis [63] after 5000 permutations of the t-test analysis and an alpha threshold < .05.
Figure 4
Figure 4
Functional connectivity maps for a seed region in right anterior insula (RAI). Rows 1 and 2 show, respectively, random effect functional connectivity t-maps [62] for controls and tinnitus displayed on inflated views of the PALS-B12 atlas surface [59]. The distribution of positive and negative correlations between time courses in the seed vs. other brain locations painted, respectively, in yellow-orange and blue (scale: p value 0.05-0.005). Row 3 shows map of a t-test assessment per node of group differences in Fisher Z-transforms of correlations. Significant t-test results marked in yellow-orange for positive and blue for negative (scale: p value 0.05-0.002). Black borders surround significant cluster identified with the threshold free cluster extension analysis [63] after 5000 permutations of the t-test analysis and an alpha threshold < .05.
Figure 5
Figure 5
Functional connectivity maps for a seed region in left inferior frontal gyrus (LIFG). Rows 1 and 2 show, respectively, random effect functional connectivity t-maps [62] for controls and tinnitus displayed on inflated views of the PALS-B12 atlas surface [59]. The distribution of positive and negative correlations between time courses in the seed vs. other brain locations painted, respectively, in yellow-orange and blue (scale: p value 0.05-0.005). Row 3 shows map of a t-test assessment per node of group differences in Fisher Z-transforms of correlations. Significant t-test results marked in yellow-orange for positive and blue for negative (scale: p value 0.05-0.002). Black borders surround significant cluster identified with the threshold free cluster extension analysis [63] after 5000 permutations of the t-test analysis and an alpha threshold < .05.

References

    1. Hoffman H, Reed G. In: Tinnitus Theory and Management. Snow JB, Hamilton J, editor. Ont.: B.C. Decker, Inc; 2004. Epidemiology of tinnitus; pp. 16–41.
    1. Jastreboff P. Phantom auditory perception (tinnitus): mechanisms of generation and perception. Neurosci Res - Suppl. 1990;8(221-254) - PubMed
    1. Adjamian P, Sereda M, Hall DA. The mechanisms of tinnitus: Perspectives from human functional neuroimaging. Hear Res. 2009;253:15–31. doi: 10.1016/j.heares.2009.04.001. - DOI - PubMed
    1. Eggermont JJ, Roberts LE. The neuroscience of tinnitus. Trends Neurosci. 2004;27:676–682. doi: 10.1016/j.tins.2004.08.010. - DOI - PubMed
    1. Møller AR. The role of neural plasticity in tinnitus. Prog Brain Res. 2007;166:37–45. - PubMed

Publication types