. 2012 Apr;123(1):33-49.
doi: 10.1016/j.cognition.2011.12.004. Epub 2012 Jan 2.

Mental visualization of objects from cross-sectional images

Affiliations

Mental visualization of objects from cross-sectional images

Bing Wu et al. Cognition. 2012 Apr.

Abstract

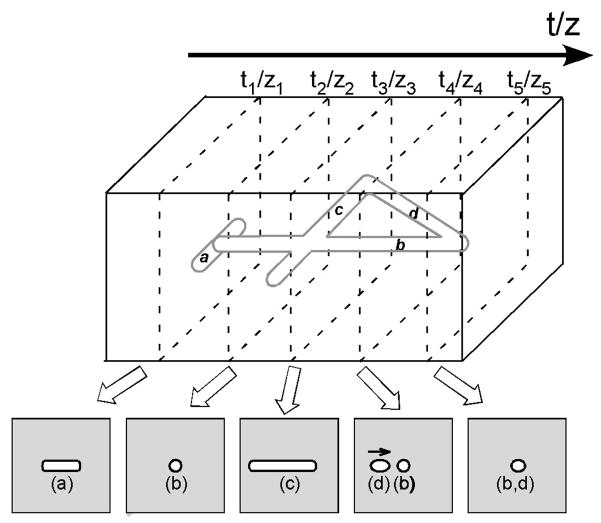
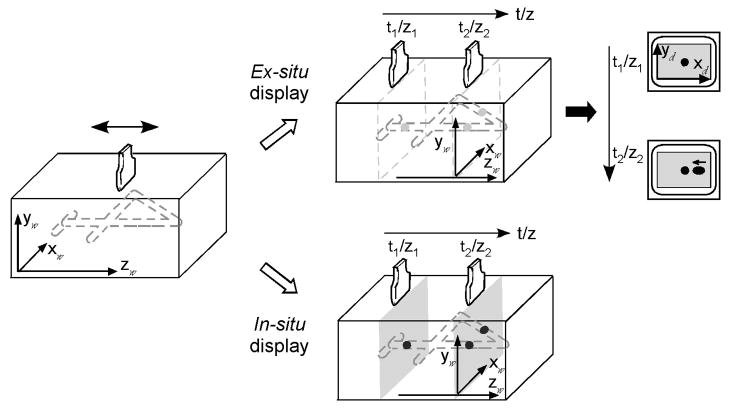
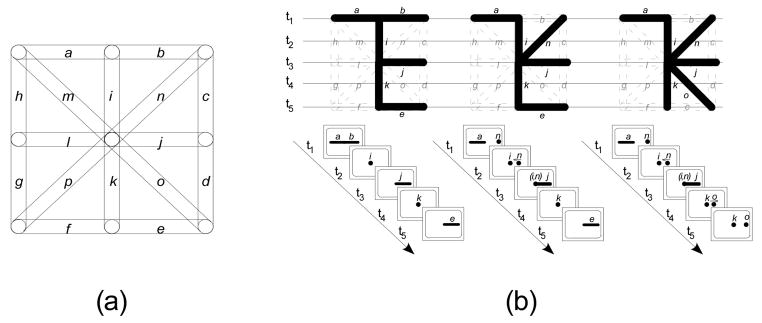
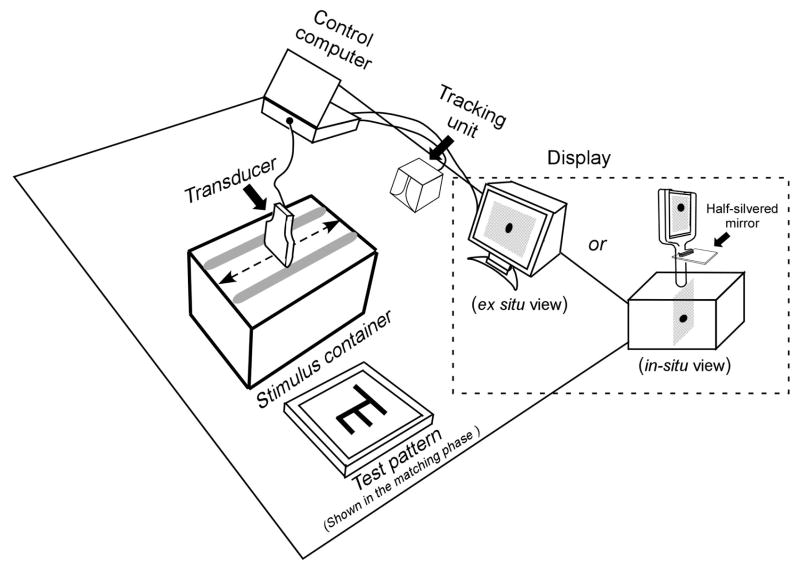
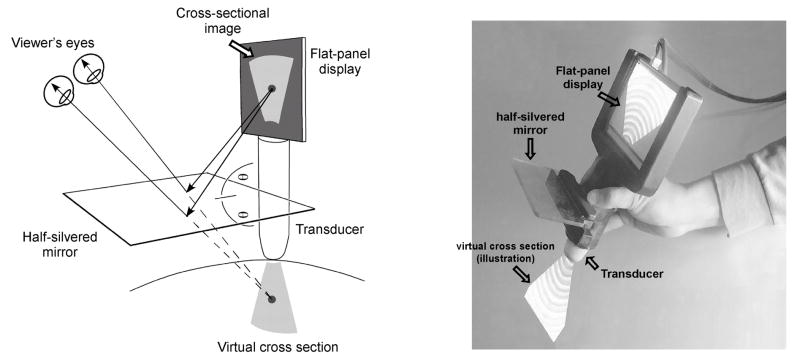
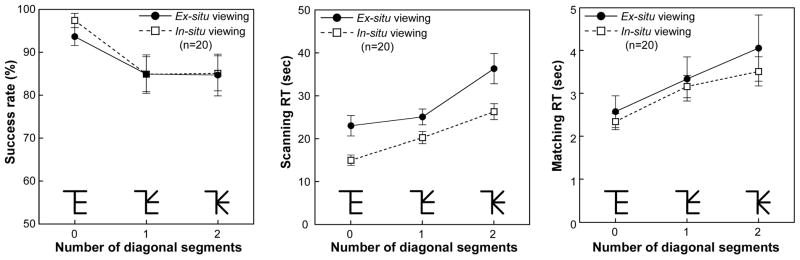
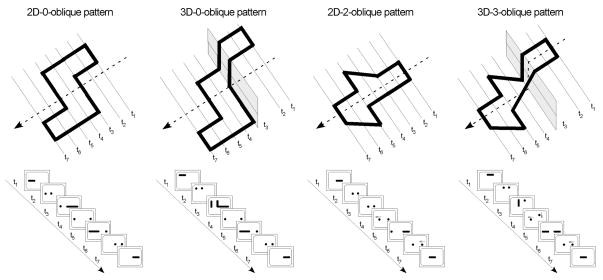
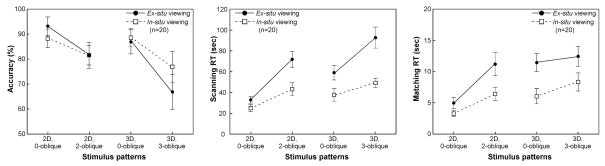
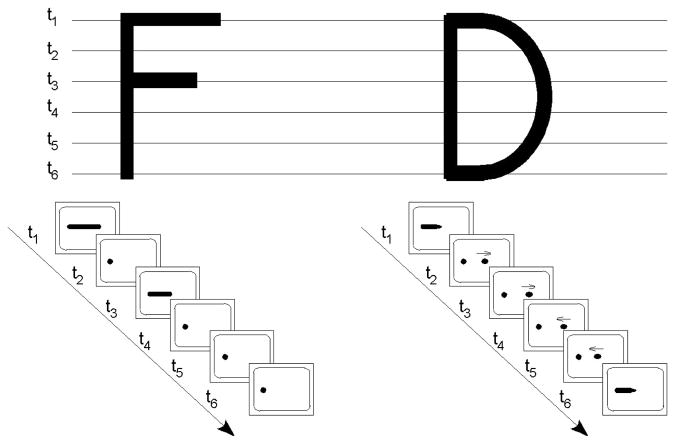
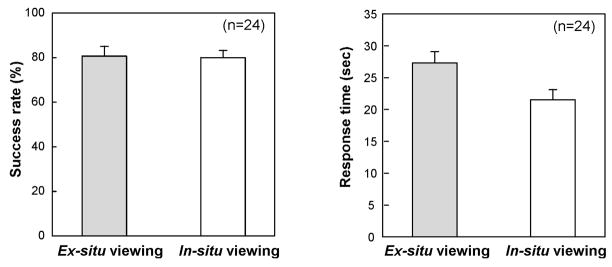
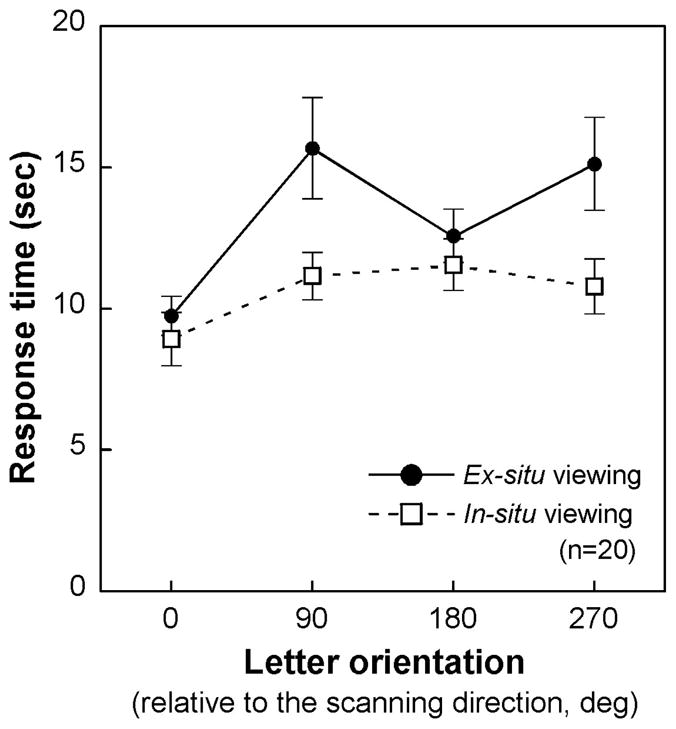
We extended the classic anorthoscopic viewing procedure to test a model of visualization of 3D structures from 2D cross-sections. Four experiments were conducted to examine key processes described in the model, localizing cross-sections within a common frame of reference and spatiotemporal integration of cross sections into a hierarchical object representation. Participants used a hand-held device to reveal a hidden object as a sequence of cross-sectional images. The process of localization was manipulated by contrasting two displays, in situ vs. ex situ, which differed in whether cross sections were presented at their source locations or displaced to a remote screen. The process of integration was manipulated by varying the structural complexity of target objects and their components. Experiments 1 and 2 demonstrated visualization of 2D and 3D line-segment objects and verified predictions about display and complexity effects. In Experiments 3 and 4, the visualized forms were familiar letters and numbers. Errors and orientation effects showed that displacing cross-sectional images to a remote display (ex situ viewing) impeded the ability to determine spatial relationships among pattern components, a failure of integration at the object level.


Figures

Figure 1
Figure 1
Illustration of the experimental task. Participants were asked to explore a hidden pattern (digit “4” constructed from round rods in this example) with a hand-held device, exposing it as a sequence of cross sectional images, and by this means to visualize the target. Alphabetic labels were assigned to the pattern segments and their cross-sections for illustration purposes.
Figure 2
Figure 2
In-situ vs. ex-situ display of cross-sectional images. In the ex-situ viewing condition (top), the cross-sectional image was displaced to on a remote monitor. With in-situ viewing (bottom), the cross-section was seen at its source location in the space of exploration. The subscripts “w” and “d” denote world and display coordinates, respectively.
Figure 3
Figure 3
(a) Pattern components. In Experiment 1 Stimulus patterns were constructed by choosing a subset of six components from a total of 16 co-planar alternatives (alphabetically labeled “a–p” for purposes of illustration, adopted after Palmer, 1977). (b) From left to right, examples of 0-, 1-, or 2-diagonal stimulus patterns (top) used in Experiment 1 and their appearance under cross-sectional sampling at five locations (bottom).
Figure 4
Figure 4
Schematic of the experimental setup. Participants used a transducer to scan a target that was hidden inside the stimulus container, exposing it as a sequence of cross-sectional images. Two types of display (in-situ vs. ex-situ) were tested.
Figure 5
Figure 5
Schematic and photograph of the in-situ display. Through the half-silvered mirror, the cross-sectional image is projected as if it “shines out” from the transducer and illuminates the internal structures (Adapted from Wu, Klatzky, Shelton, & Stetten, 2005, with permission, © 2005 IEEE).
Figure 6
Figure 6
The results of Experiment 1. The mean accuracy, scanning RTs, and matching RTs in two viewing conditions were plotted as functions of the number of oblique segments in the pattern. Error bars represent the standard error of the mean.
Figure 7
Figure 7
Stimulus objects used in Experiment 2. Examples of 2D-0-oblique patterns, 2D-2-oblique patterns, 3D-0-oblique patterns, and 3D-3-oblique patterns and their appearance under cross-sectional sampling at seven locations.
Figure 8
Figure 8
The results of Experiment 2. The mean accuracy, scanning RTs, and matching RTs in two viewing conditions were plotted as functions of stimulus group. Error bars represent the standard error of the mean.
Figure 9
Figure 9
Examples of the stimulus letters used in Experiment 3.
Figure 10
Figure 10
The mean accuracy and RTs observed in Experiment 3. Error bars represent the standard error of the mean.
Figure 11
Figure 11
The mean RT observed in Experiment 4 as a function of stimulus orientation. Error bars represent the standard error of the mean.

References

    1. Biederman I. Recognition-by-components: a theory of human image understanding. Psychological Review. 1987;94(2):115–147. - PubMed
    1. Bingham GP, Lind M. Large continuous perspective transformations are necessary and sufficient for perception of metric shape. Perception & Psychophysics. 2008;70(3):524–540. - PubMed
    1. Bülthoff HH, Edelman S, Tarr MJ. How are three-dimensional objects represented in the brain? Cerebral Cortex. 1995;5:247–260. - PubMed
    1. Day RH. Apparent depth from progressive exposure of moving shadows: the kinetic depth effect in a narrow aperture. Bulletin of the Psychonomic Society. 1989;27(4):320–322.
    1. Fendrich R, Rieger JW, Heinze HJ. The effect of retinal stabilization on anorthoscopic percepts under free-viewing conditions. Vision Research. 2005;45:567–582. - PubMed

Publication types

LinkOut - more resources