

Improving the performance of computer-aided detection of subtle breast masses using an adaptive cueing method
- PMID: 22218075
- PMCID: PMC3310913
- DOI: 10.1088/0031-9155/57/2/561
Improving the performance of computer-aided detection of subtle breast masses using an adaptive cueing method
Abstract
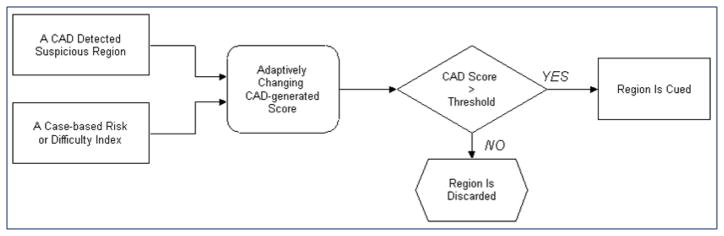
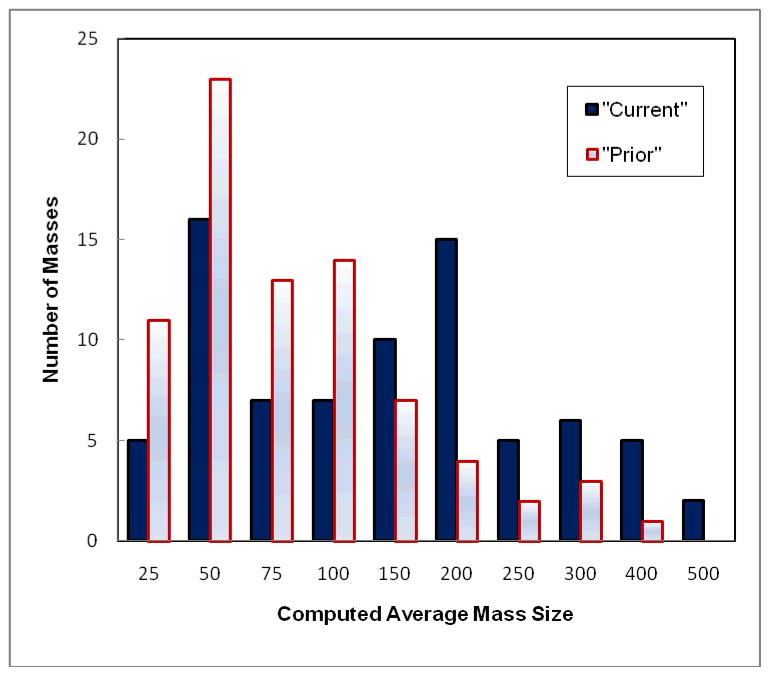
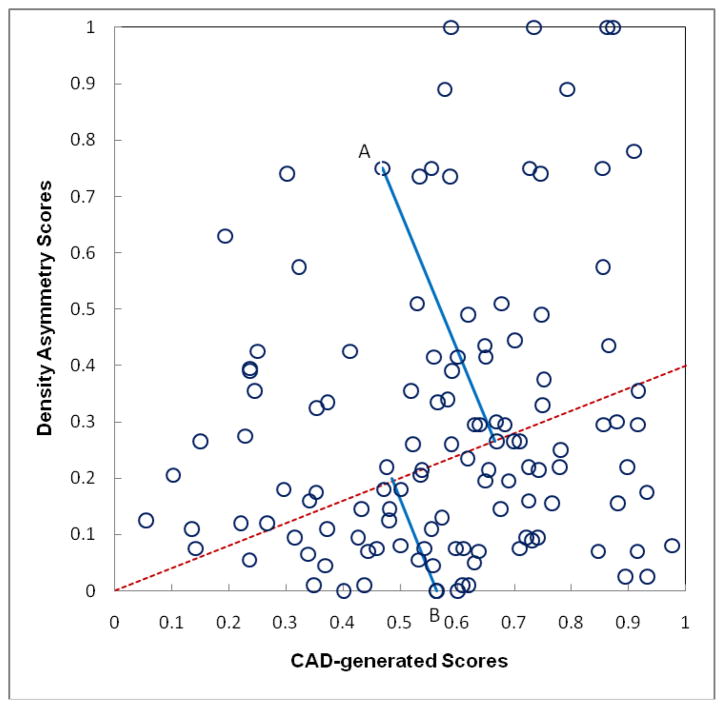
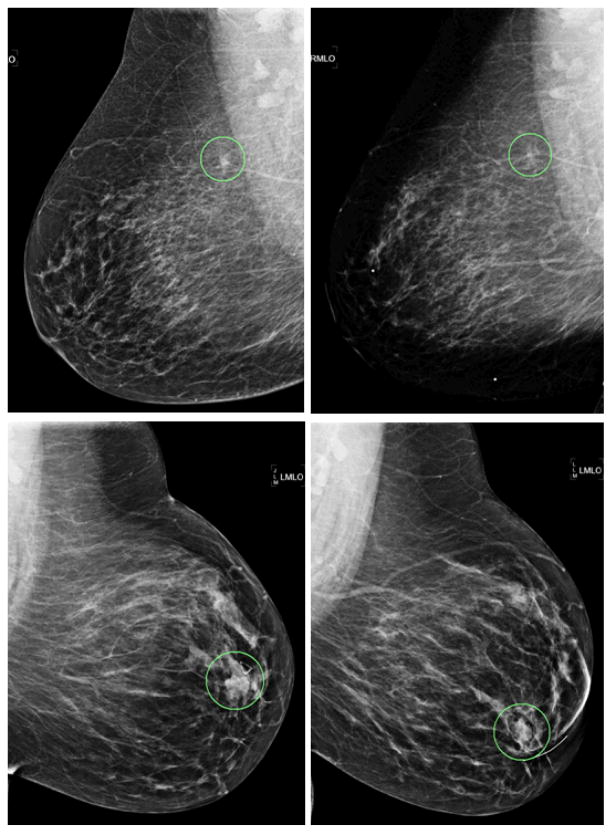
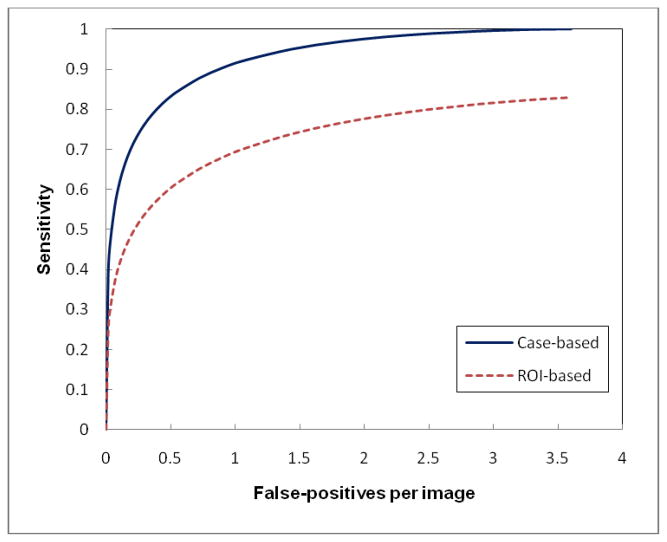
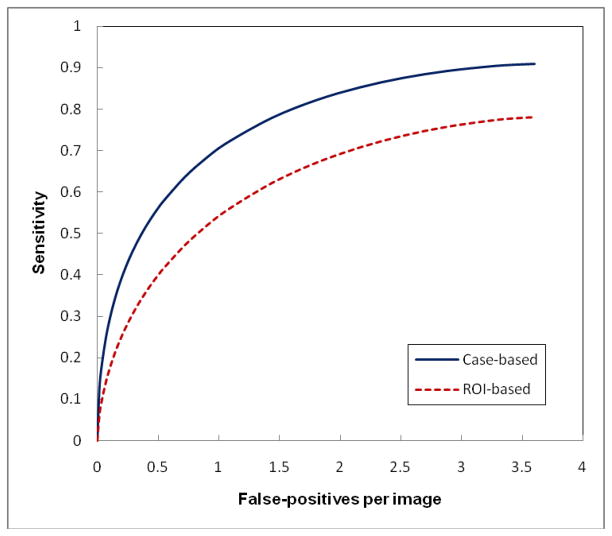
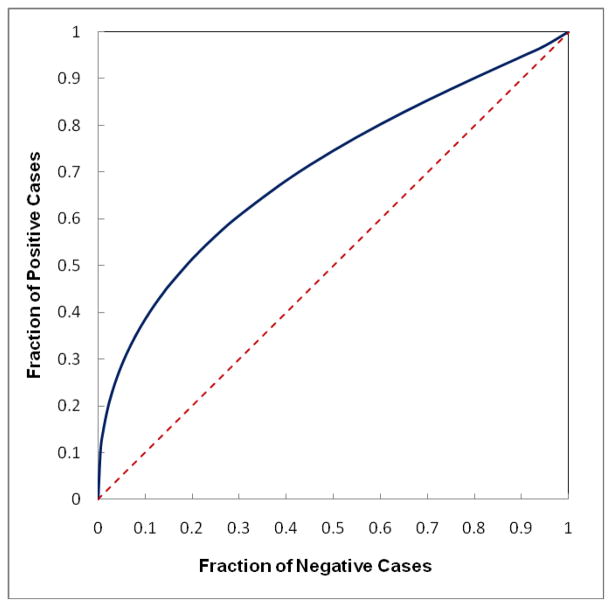
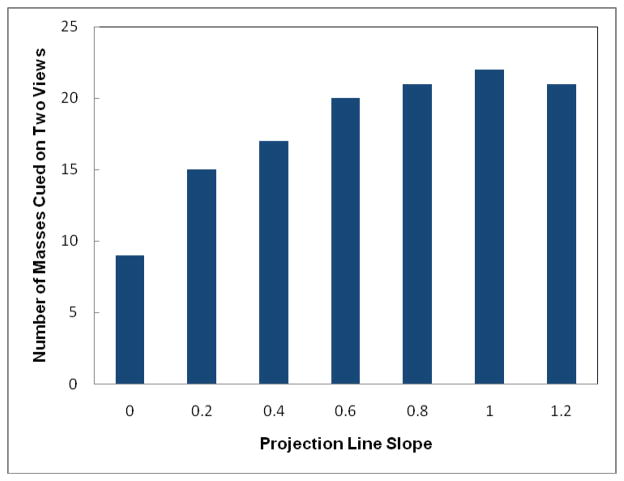
Current computer-aided detection (CAD) schemes for detecting mammographic masses have several limitations including high correlation with radiologists' detection and cueing most subtle masses only on one view. To increase CAD sensitivity in cueing more subtle masses that are likely missed and/or overlooked by radiologists without increasing false-positive rates, we investigated a new case-dependent cueing method by combining the original CAD-generated detection scores with a computed bilateral mammographic density asymmetry index. Using the new method, we adaptively raise the CAD-generated scores of the regions detected on 'high-risk' cases to cue more subtle mass regions and reduce the CAD scores of the regions detected on 'low-risk' cases to discard more false-positive regions. A testing dataset involving 78 positive and 338 negative cases was used to test this adaptive cueing method. Each positive case involves two sequential examinations in which the mass was detected in 'current' examination and missed in 'prior' examination but detected in a retrospective review by radiologists. Applying to this dataset, a pre-optimized CAD scheme yielded 75% case-based and 55% region-based sensitivity on 'current' examinations at a false-positive rate of 0.25 per image. CAD sensitivity was reduced to 42% (case based) and 27% (region based) on 'prior' examinations. Using the new cueing method, case-based and region-based sensitivity could maximally increase 9% and 33% on the 'prior' examinations, respectively. The percentages of the masses cued on two views also increased from 27% to 65%. The study demonstrated that using this adaptive cueing method enabled us to help CAD cue more subtle cancers without increasing the false-positive cueing rate.
Figures
Similar articles
-
Improving performance of computer-aided detection of masses by incorporating bilateral mammographic density asymmetry: an assessment.Acad Radiol. 2012 Mar;19(3):303-10. doi: 10.1016/j.acra.2011.10.026. Epub 2011 Dec 14. Acad Radiol. 2012. PMID: 22173323 Free PMC article.
-
Multiview-based computer-aided detection scheme for breast masses.Med Phys. 2006 Sep;33(9):3135-43. doi: 10.1118/1.2237476. Med Phys. 2006. PMID: 17022205
-
Computer-aided detection; the effect of training databases on detection of subtle breast masses.Acad Radiol. 2010 Nov;17(11):1401-8. doi: 10.1016/j.acra.2010.06.009. Epub 2010 Jul 22. Acad Radiol. 2010. PMID: 20650667 Free PMC article.
-
Computer-aided detection in mammography.Clin Radiol. 2004 May;59(5):390-9. doi: 10.1016/j.crad.2003.11.017. Clin Radiol. 2004. PMID: 15081844 Review.
-
Computer-aided detection for screening mammography.Acad Radiol. 2004 Oct;11(10):1139-43. doi: 10.1016/j.acra.2004.07.009. Acad Radiol. 2004. PMID: 15530806 Review.
Cited by
-
A new approach to develop computer-aided detection schemes of digital mammograms.Phys Med Biol. 2015 Jun 7;60(11):4413-27. doi: 10.1088/0031-9155/60/11/4413. Epub 2015 May 18. Phys Med Biol. 2015. PMID: 25984710 Free PMC article.
-
Developing a Quantitative Ultrasound Image Feature Analysis Scheme to Assess Tumor Treatment Efficacy Using a Mouse Model.Sci Rep. 2019 May 13;9(1):7293. doi: 10.1038/s41598-019-43847-7. Sci Rep. 2019. PMID: 31086267 Free PMC article.
-
Reduction of false-positive recalls using a computerized mammographic image feature analysis scheme.Phys Med Biol. 2014 Aug 7;59(15):4357-73. doi: 10.1088/0031-9155/59/15/4357. Epub 2014 Jul 17. Phys Med Biol. 2014. PMID: 25029964 Free PMC article.
-
Developing a new case based computer-aided detection scheme and an adaptive cueing method to improve performance in detecting mammographic lesions.Phys Med Biol. 2017 Jan 21;62(2):358-376. doi: 10.1088/1361-6560/aa5081. Epub 2016 Dec 20. Phys Med Biol. 2017. PMID: 27997380 Free PMC article.
-
Computer-aided diagnosis of breast DCE-MRI images using bilateral asymmetry of contrast enhancement between two breasts.J Digit Imaging. 2014 Feb;27(1):152-60. doi: 10.1007/s10278-013-9617-4. J Digit Imaging. 2014. PMID: 24043592 Free PMC article.
References
-
- Birdwell RL, Ikeda DM, O’Shaughnessy KF, Sickles EA. Mammographic characteristics of 115 missed cancers later detected with screening mammography and the potential utility of computer-aided detection. Radiology. 2001;219:192–202. - PubMed
-
- Chang YH, Wang XH, Hardesty LA, et al. Computerized assessment of tissue composition on digitized mammograms. Acad Radiol. 2002;9:898–905. - PubMed
Publication types
MeSH terms
Grants and funding
LinkOut - more resources
Full Text Sources
Medical
Miscellaneous