. 2012 May;37(6):1338-56.
doi: 10.1038/npp.2011.320. Epub 2012 Jan 4.

Increased Kv1 channel expression may contribute to decreased sIPSC frequency following chronic inhibition of NR2B-containing NMDAR

Affiliations

Increased Kv1 channel expression may contribute to decreased sIPSC frequency following chronic inhibition of NR2B-containing NMDAR

Shuijin He et al. Neuropsychopharmacology. 2012 May.

Abstract

Numerous studies have documented the effects of chronic N-methyl-D-aspartate receptor (NMDAR) blockade on excitatory circuits, but the effects on inhibitory circuitry are not well studied. NR2A- and NR2B-containing NMDARs play differential roles in physiological processes, but the consequences of chronic NR2A- or NR2B-containing NMDAR inhibition on glutamatergic and GABAergic neurotransmission are unknown. We investigated altered GABAergic neurotransmission in dentate granule cells and interneurons following chronic treatment with the NR2B-selective antagonist, Ro25,6981, the NR2A-prefering antagonist, NVP-AAM077, or the non-subunit-selective NMDAR antagonist, D-APV, in organotypic hippocampal slice cultures. Electrophysiological recordings revealed large reductions in spontaneous inhibitory postsynaptic current (sIPSC) frequency in both granule cells and interneurons following chronic Ro25,6981 treatment, which was associated with minimally altered sIPSC amplitude, miniature inhibitory postsynaptic current (mIPSC) frequency, and mIPSC amplitude, suggesting diminished action potential-dependent GABA release. Chronic NVP-AAM077 or D-APV treatment had little effect on these measures. Reduced sIPSC frequency did not arise from downregulated GABA(A)R, altered excitatory or inhibitory drive to interneurons, altered interneuron membrane properties, increased failure rate, decreased action potential-dependent release probability, or mGluR/GABA(B) receptor modulation of GABA release. However, chronic Ro25,6981-mediated reductions in sIPSC frequency were occluded by the K+ channel blockers, dendrotoxin, margatoxin, and agitoxin, but not dendrotoxin-K or XE991. Immunohistochemistry also showed increased Kv1.2, Kv1.3, and Kv1.6 in the dentate molecular layer following chronic Ro25,6981 treatment. Our findings suggest that increased Kv1 channel expression/function contributed to diminished action potential-dependent GABA release following chronic NR2B-containing NMDAR inhibition and that these Kv1 channels may be heteromeric complexes containing Kv1.2, Kv1.3, and Kv1.6.


Figures
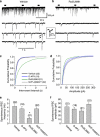
Figure 1
Figure 1
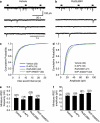
Spontaneous IPSC frequency was reduced in granule cells from hippocampal slice cultures treated chronically with Ro25,6981. Spontaneous IPSCs were recorded at a −70 mV holding potential in recording buffer containing D-APV (50 μM) and CNQX (10 μM). (a, b) Representative sIPSC recordings following chronic (a) vehicle or (b) Ro25,6981 in granule cells illustrate the large reductions in sIPSC frequency with only modest reductions in sIPSC amplitude. Arrows indicate near-synchronous sIPSCs, shown in an expanded timescale in the inset. (c, d) Cumulative probability plots reveal (c) slight but significant changes in sIPSC frequency following chronic NVP-AAM077 and D-APV, but dramatically reduced sIPSC frequency following chronic Ro25,6981. (d) They also show modestly reduced sIPSC amplitude following chronic treatment with all the NMDAR antagonists (difference in sIPSC frequency and amplitude between all treatment groups, p<0.025, Kolmogorov–Smirnov test). (e, f) Bar graphs reveal that sIPSC (e) frequency was dramatically reduced but (f) amplitude was not significantly altered in granule cells following chronic Ro25,6981 treatment. Scale bars in (a, middle) apply to (a) and (b). Legend in (c) applies to (c) and (d). The number of granule cells/slice cultures is indicated in parentheses. *Different than vehicle, D-APV, and NVP-AAM077; p<0.05, ANOVA with Holm–Sidak post-hoc comparison.
Figure 2
Figure 2
Miniature IPSC frequency and amplitude were minimally altered in granule cells from hippocampal slice cultures treated chronically with NMDAR antagonists. Miniature IPSCs were recorded at a −70 mV holding potential in recording buffer containing D-APV (50 μM), CNQX (10 μM), and TTX (1 μM). (a, b) Representative mIPSC recordings following chronic (a) vehicle or (b) Ro25,6981 in granule cells illustrate little change in mIPSC frequency or amplitude. (c, d) Cumulative probability plots reveal (c) minor changes in mIPSC frequency and (d) slight increases in mIPSC amplitude following chronic treatment with NVP-AAM077 or Ro25,6981 (difference in mIPSC frequency and amplitude between all treatment groups except vehicle vs D-APV, p<0.025, Kolmogorov–Smirnov test). (e, f) Bar graphs reveal that mIPSC (e) frequency and (f) amplitude in granule cells were not significantly altered following chronic treatment with NMDAR antagonists. Scale bars in (a, middle) apply to (a) and (b). Legend in (c) applies to (c) and (d). The number of granule cells/slice cultures is indicated in parentheses.
Figure 3
Figure 3
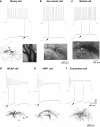
Firing patterns and axonal distributions were used to classify different types of interneurons. Interneurons were characterized as described previously (Buckmaster and Schwartzkroin, 1995a, 1995b; Halasy and Somogyi, 1993; Han et al, 1993; Mott et al, 1997) except everywhere cells, which were described by Mott et al (1997) but named here. (a–e, top) Representative traces from the first current step to elicit strong adaptation and spike broadening in HICAP, HIPP, and everywhere cells, and a corresponding current step amplitude for mossy, axoaxonic, and basket cells. (a–e, middle) Representative traces from the first current step to elicit an action potential. (a–e, bottom) Representative morphology and axonal distributions of neurobiotin-filled neurons. (a) Mossy cells were characterized by high-frequency firing, a shallow AHP (dashed line, plateau potential), dendrites covered with dense ‘thorny excrescences' (bottom right, white arrowheads), and axons distributed throughout the dentate gyrus and hilus. Recorded cells with these characteristics were excluded from further analyses. (b) Axoaxonic cells were characterized by high-frequency firing, action potentials with deep, short-duration AHP, as well as large somata, chandelier-like rows of boutons and axonal arborizations predominantly in the granule cell and the CA3c pyramidal cell layers. (c) Basket cells displayed high-frequency firing, action potentials with deep, short-duration AHP, and large somata and axons almost entirely restricted to the granule cell layer with net-like boutons surrounding granule cells. (d) Hilar commissural-associational pathway-associated interneurons (HICAP cells) were defined by adapting firing, deep, long-lasting AHP, and axonal collaterals distributed predominantly in the outer granule cell layer and the inner one-third of the molecular layer. Dendrites usually bifurcated bidirectionally into the molecular layer after crossing the granule cell layer and the hilus, and were either aspiny or sparsely spiny. (e) Hilar perforant pathway-related interneurons (HIPP cells) were characterized by adapting firing, deep intermediate-lasting AHP, and axonal collaterals distributed predominantly in the outer two-third of the molecular layer. Dendrites were often restricted to the hilus and covered with long thin spines. (f) Everywhere cells were characterized by adapting firing, deep long-duration AHP and axons that arborized radially throughout all regions of the dentate gyrus, hilus, and the CA3 pyramidal cell layer. Representative mossy, axoaxonic, basket, HICAP, HIPP, and everywhere cells were taken from Ro25,6981-, Ro25,6981-, vehicle-, D-APV-, memantine-, and NVP-AAM077-treated cultures, respectively. Arrows in (a–f, middle) indicate AHP. Scale bars in (f, middle) apply to all electrophysiological traces; scale bar in (f, bottom) applies to all digitally reconstructed neurons in (a, d–f). Thick black lines in all digitally reconstructed neurons denote dendrites, thin gray lines denote axons, and thin gray lines delineate regions. BC, basket cell; EC, everywhere cell; g, granule cell layer; h, hilus; HICAP cell, hilar commissural-associational pathway-associated interneuron; HIPP cell, hilar perforant pathway-associated interneuron; m, molecular layer.
Figure 4
Figure 4
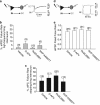
Spontaneous IPSC frequency was reduced in dentate/hilar border interneurons from hippocampal slice cultures treated chronically with Ro25,6981. Spontaneous IPSCs and mIPSCs were recorded as described in Figures 1 and 2, respectively. No significant differences between different D/H border interneuron populations were apparent, and data from all interneurons were compiled. Bar graphs reveal that compared with vehicle (a) sIPSC (a1) frequency was dramatically reduced but (a2) amplitude was not significantly altered in interneurons following chronic treatment with Ro25,6981. (b) Miniature IPSC (b1) frequency and (b2) amplitude in interneurons were not significantly altered following chronic treatment with NMDAR antagonists. The number of interneurons/slice cultures is indicated in parentheses as (adapting firing interneurons, high-frequency firing interneurons). *Different than vehicle, D-APV, and NVP-AAM077; #Different than NVP-AAM077; p<0.05, ANOVA with Holm–Sidak post-hoc comparison.
Figure 5
Figure 5
Action potential firing was increased in adapting firing interneurons from hippocampal slice cultures treated chronically with D-APV and NVP-AAM077. Whole-cell current-clamp recordings were conducted as described in the Materials and methods to determine the number of action potentials fired in response to a series of 450 ms 25 pA steps. Input–output curves were grouped into (a) high-frequency (basket and axoaxonic cells) and (b) adapting (HIPP, HICAP, and everywhere cells) firing interneurons because the firing behavior was different across but not within these populations. The number of action potentials generated by current steps above 250 pA was not quantified in adapting firing interneurons because spike number reached a plateau and the spikes were significantly wider in half-width and greatly diminished in amplitude (see Figure 3d–f), making the action potential difficult to precisely define. The number of action potentials generated in response to current steps (a) was not significantly altered in high-frequency firing interneurons following chronic treatment with NMDAR antagonists, but (b) was increased in adapting firing interneurons following chronic treatment with D-APV or NVP-AAM077 compared with vehicle or Ro25,6981. Note the difference in the x-axis scale in (a) and (b). The number of interneuron/slice cultures is indicated in parentheses. *Different than vehicle; #Different than Ro25,6981; p<0.05, two-way ANOVA with Holm–Sidak post-hoc comparison.
Figure 6
Figure 6
Evoked IPSC (eIPSC) failure rate and paired-pulse ratio were similar in granule cells from cultures treated with vehicle and NMDAR antagonists. Paired whole-cell recordings between single dentate granule cells and D/H border interneurons were conducted as described in the Materials and methods to document eIPSC failure rate and release probability. (a, left) A schematic of a paired recording between a single interneuron and granule cell. (a, right) A representative trace of an evoked action potential in the presynaptic interneuron and the subsequent eIPSC in a postsynaptic granule cell from a vehicle-treated culture. Failure data were grouped into high-frequency (basket and axoaxonic cells) and adapting (HIPP, HICAP, and everywhere cells) firing interneurons because the failure rate was different across but not within these populations. Bar graphs reveal no significant changes in eIPSC failure rate in granule cells following repeated action potential generation in either (b) high-frequency firing interneurons (axoaxonic and basket cells) or (c) adapting firing interneurons (HICAP, HIPP, and everywhere cells) following chronic NMDAR inhibition. Note the difference in the y-axis scale in (b) and (c). (d, left) A schematic of a paired recording from an interneuron to a granule cell and (d, right) a representative trace of a pair of evoked action potentials in a presynaptic interneuron and subsequent a pair of evoked IPSCs in a postsynaptic granule cell from a vehicle-treated culture. (e) Bar graph reveals no significant difference in eIPSC paired-pulse ratio between individual interneurons and granule cells in different treatment groups. Data were grouped for all D/H interneurons because there was no significant difference between distinct types of interneurons (data not shown). The number of slice cultures is indicated in parentheses. GC, granule cell; IN, interneuron.
Figure 7
Figure 7
The frequency and amplitude of sIPSCs in granule cells were unchanged after blockade of GABAB receptors and group III metabotropic glutamate receptors (mGluR). Spontaneous IPSCs were recorded as described in the Materials and methods and Figure 1. Bar graphs revealed that acute blockade of GABABR with CGP55845 (3 μM) and group III mGluR with CPPG (200 μM) did not affect sIPSC (left) frequency or (right) amplitude in granule cells from cultures treated with vehicle or Ro25,6981. Legend in (left) applies to (left) and (right). The number of granule cells/slice cultures is indicated in parentheses; *p<0.05; **p<0.01, different than vehicle, t-test.
Figure 8
Figure 8
Two broad-acting voltage-gated potassium channel antagonists abolished the difference in sIPSCs onto granule cells in vehicle- and Ro25,6981-treated cultures. Spontaneous IPSCs were recorded as described in the Materials and methods and Figure 1. Concentration-response curves showed that as little as 10 μM 4-aminopyridine (4-AP) abolished the differences in sIPSC (a1) frequency and (a2) amplitude. Concentration-response curves showed that 20 mM tetraethylammonium (TEA) abolished the differences in sIPSC (b1) frequency and (b2) amplitude between vehicle- and Ro25,6981-treated cultures. Legend in (a1) applies to (a1–2), and in (b1) applies to (b1–2). The number of slice cultures is indicated in parentheses; *p<0.05; **p<0.01, different than vehicle, t-test.
Figure 9
Figure 9
Acute blockade of Kv1 but not Kv7 channels occluded reductions in sIPSC frequency following chronic inhibition of NR2B-containing NMDARs. Recordings of sIPSCs in granule cells were conducted as described in the Materials and methods and Figure 1. Acute application of Kv1 channel blockers (a) dendrotoxin (200 nM) or (b) margatoxin (10 nM) occluded the difference between chronic vehicle and Ro25,6981 treatment in (a, b left) sIPSC frequency, but had no significant effect on (a, b right) sIPSC amplitude. Acute application of (c) dendrotoxin-K (100 nM) increased (c, left) sIPSC frequency in granule cells from both vehicle- and Ro25,6981-treated cultures, but did not occlude the difference between chronic vehicle and Ro25,6981 treatment and had little effect on (c, right) sIPSC amplitude. Acute blockade of Kv7 channels with (d) XE 991 (10 μM) had no effect on (d, left) sIPSC frequency or (d, right) amplitude in granule cells from either vehicle- and Ro25,6981-treated cultures. Legend in (a–d, left) applies to (a–d, left and right). ‘Before' denotes measurements taken before acute application of blockers, and ‘after' denotes measurements taken after acute application of blockers in the same cells. The number of granule cells is indicated in parentheses; *p<0.05; **p<0.01, ***p<0.001 different than vehicle, t-test. Δp<0.05; ΔΔp<0.01; ΔΔΔp<0.001 different than before in same chronic treatment group, paired t-test.
Figure 10
Figure 10
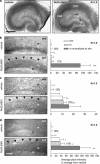
Kv1 channel expression was significantly increased in the dentate molecular layer in hippocampal slice cultures treated chronically with Ro25,6981. Hippocampal slice cultures were stained immunohistochemically for Kv1.2, Kv1.3, and Kv1.6 and analyzed as described in the Materials and methods. (a) Representative low-power images of Kv1.6 immunoreactivity in organotypic hippocampal slice cultures treated with (left) vehicle or (right) Ro25,6981. Dashed box (left) illustrates the approximate location of higher power images in (b–d). Black and white boxes (right) show the approximate locations for CA1 stratum lacunosum moleculare and dentate molecular layer quantification, respectively. (b–d) Representative higher-power images (left) and bar graphs of compiled quantification (right) of (b) Kv1.6, (c) Kv1.3, and (d) Kv1.2 immunoreactivity show increased expression (arrowheads) in the dentate molecular layer. The number of slice cultures is indicated in parentheses. Labels in (b–d, left) apply to micrographs (b–d, left) and bar graphs (b–d, right). Legend in (b, right) applies to (b–d, right) and represents the order of data presentation for both vehicle and Ro25,6981. Scale bar (a, left, 500 μm) applies to both panels in (a); (d, bottom, 100 μm) to all left panels in (b–d). g, granule cell layer; h, hilus; m, molecular layer; slm, stratum lacunosum moleculare. *p<0.05; **p⩽0.01; ***p<0.005, different than vehicle, Mann–Whitney rank sum test.

References

    1. Aiyar J, Nguyen AN, Chandy KG, Grissmer S. The P-region and S6 of Kv3.1 contribute to the formation of the ion conduction pathway. Biophys J. 1994;67:2261–2264. - PMC - PubMed
    1. Akhtar S, Shamotienko O, Papakosta M, Ali F, Dolly JO. Characteristics of brain Kv1 channels tailored to mimic native counterparts by tandem linkage of alpha subunits: implications for K+ channelopathies. J Biol Chem. 2002;277:16376–16382. - PubMed
    1. Arnold DB. Polarized targeting of ion channels in neurons. Pflugers Arch. 2007;453:763–769. - PubMed
    1. Auberson YP, Allgeier H, Bischoff S, Lingenhoehl K, Moretti R, Schmutz M. 5-Phosphonomethylquinoxalinediones as competitive NMDA receptor antagonists with a preference for the human 1A/2A, rather than 1A/2B receptor composition. Bioorg Med Chem Lett. 2002;12:1099–1102. - PubMed
    1. Barria A, Malinow R. Subunit-specific NMDA receptor trafficking to synapses. Neuron. 2002;35:345–353. - PubMed

Publication types

MeSH terms