. 2013 Apr;35(2):271-88.
doi: 10.1007/s11357-011-9347-9. Epub 2012 Jan 5.

Chronic hyponatremia exacerbates multiple manifestations of senescence in male rats

Affiliations

Chronic hyponatremia exacerbates multiple manifestations of senescence in male rats

Julia Barsony et al. Age (Dordr). 2013 Apr.

Abstract

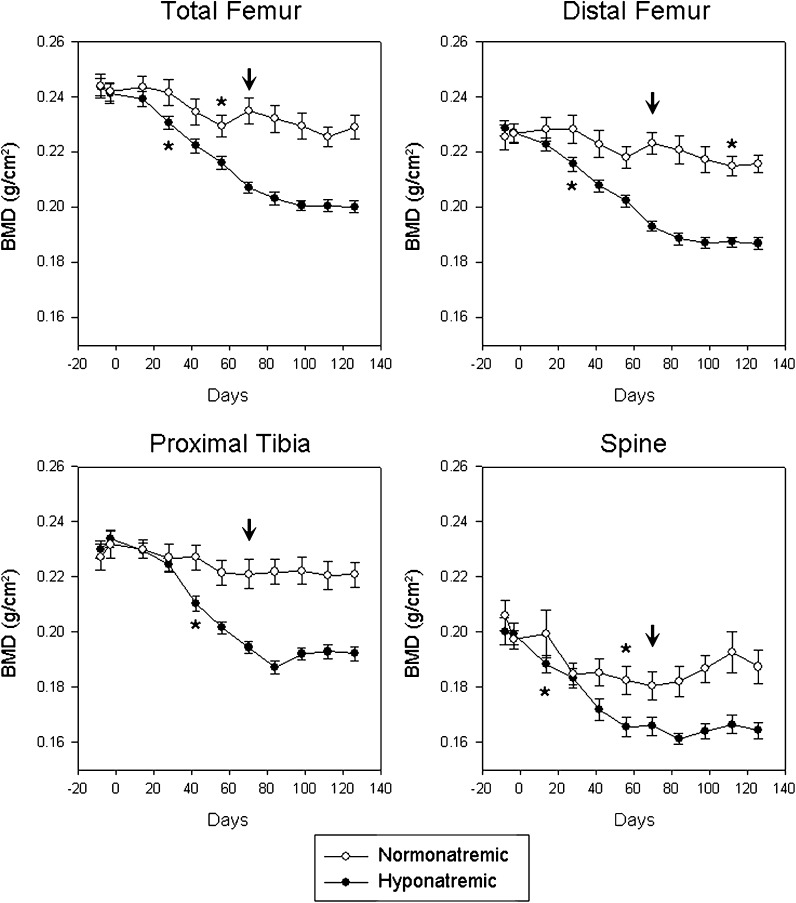
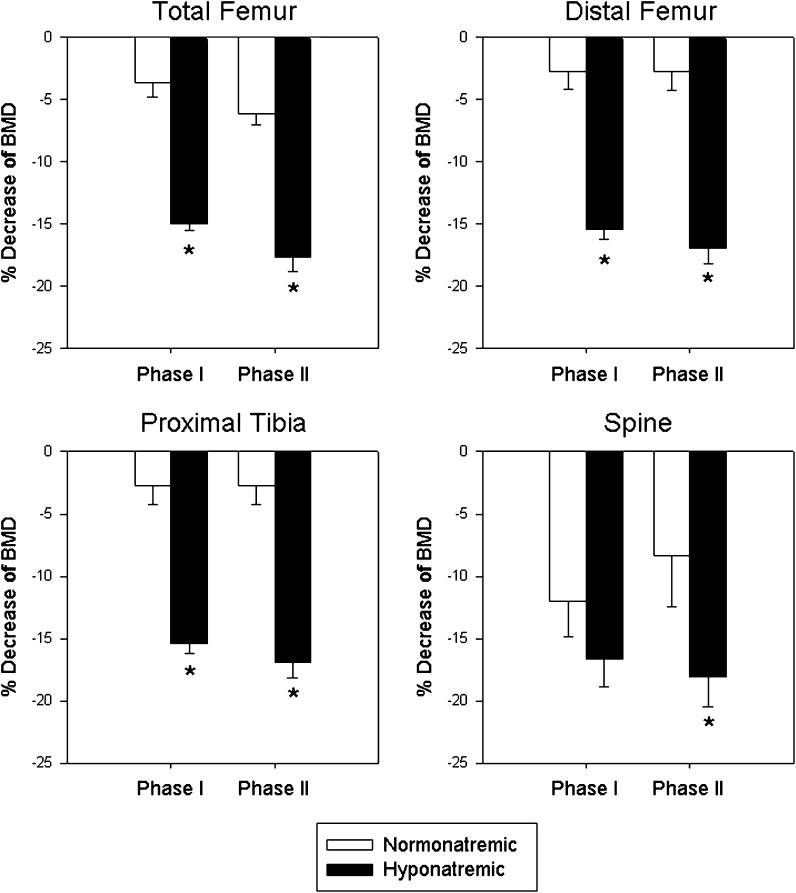
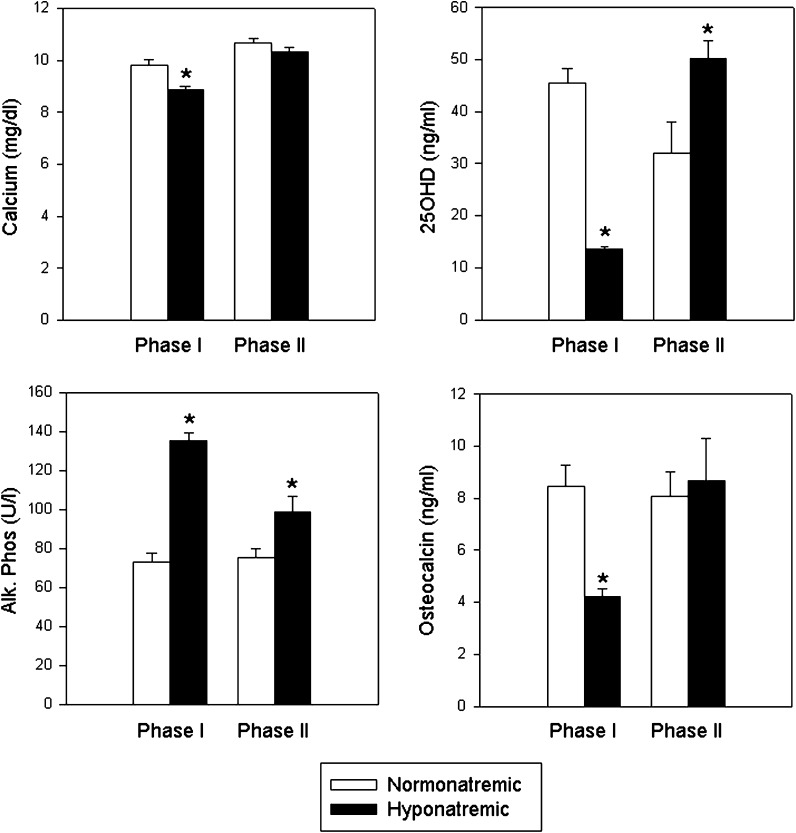
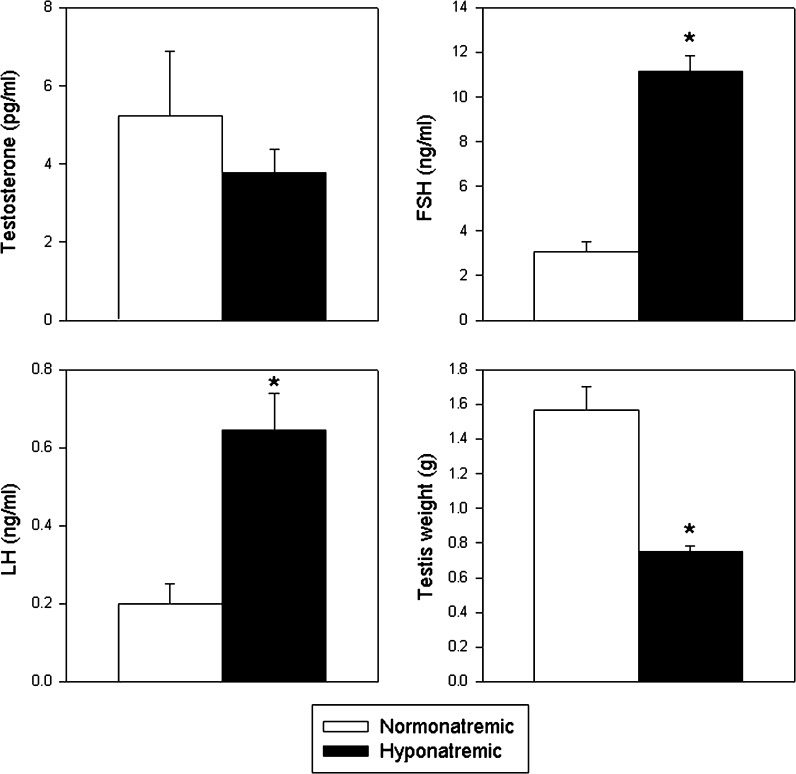
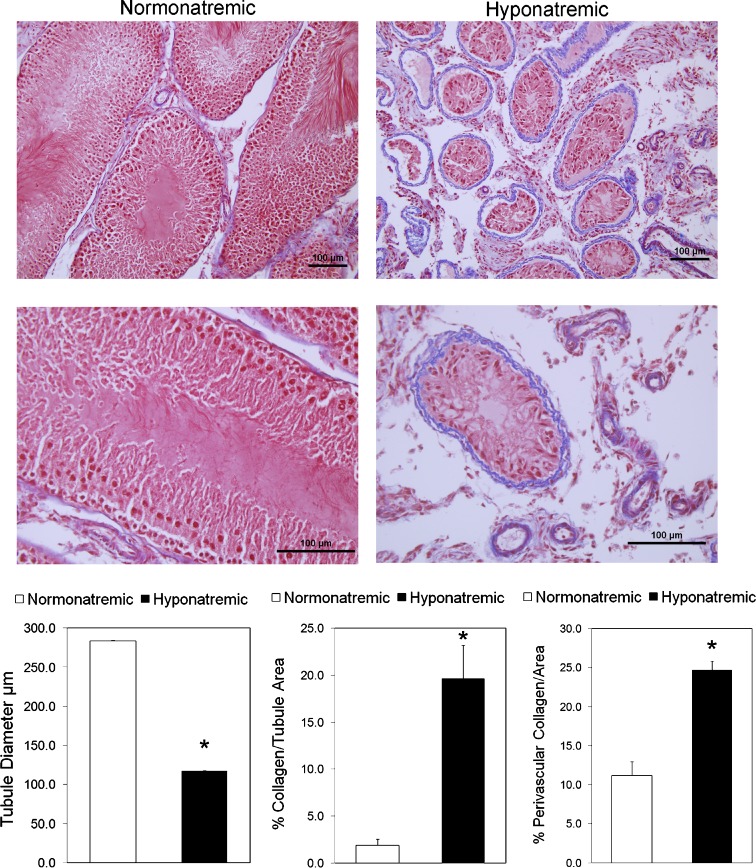
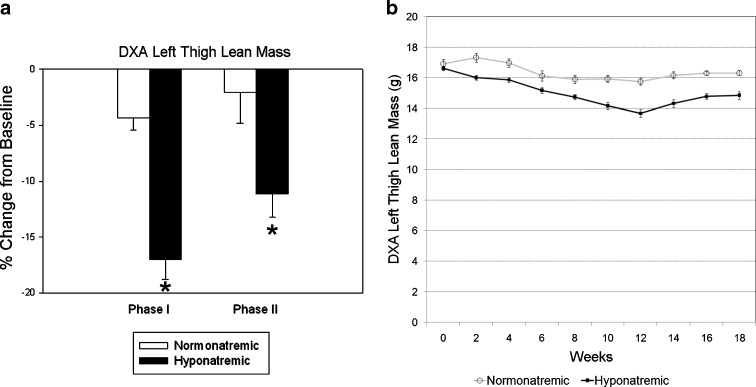
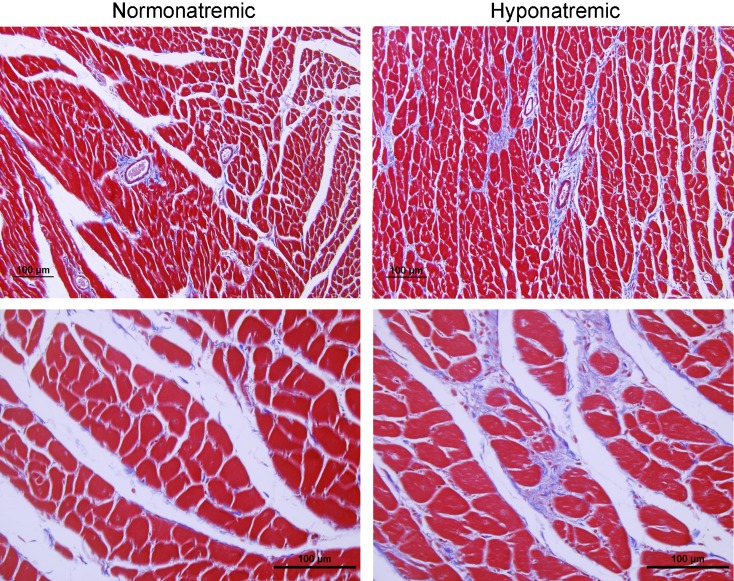
The syndrome of inappropriate antidiuretic hormone secretion (SIADH) is frequently responsible for chronic hyponatremia in the elderly due to age-related disruption of the inhibitory component of brain osmoregulatory mechanisms. Recent research has indicated that chronic hyponatremia is associated with gait disturbances, increased falls, and bone fragility in humans, and we have found that chronic hyponatremia causes increased bone resorption and reduced bone mineral density in young rats. In this study, we used a model of SIADH to study multi-organ consequences of chronic hyponatremia in aged rats. Sustained hyponatremia for 18 weeks caused progressive reduction of bone mineral density by DXA and decreased bone ash calcium, phosphate and sodium contents at the tibia and lumbar vertebrae. Administration of 10-fold higher vitamin D during the last 8 weeks of the study compensated for the reduction in bone formation and halted bone loss. Hyponatremic rats developed hypogonadism, as indicated by slightly lower serum testosterone and higher serum FSH and LH concentrations, markedly decreased testicular weight, and abnormal testicular histology. Aged hyponatremic rats also manifested decreased body fat, skeletal muscle sarcopenia by densitometry, and cardiomyopathy manifested as increased heart weight and perivascular and interstitial fibrosis by histology. These findings are consistent with recent results in cultured osteoclastic cells, indicating that low extracellular sodium concentrations increased oxidative stress, thereby potentially exacerbating multiple manifestations of senescence. Future prospective studies in patients with SIADH may indicate whether these multi-organ age-related comorbidities may potentially contribute to the observed increased incidence of fractures and mortality in this population.


Figures

Fig. 1
Fig. 1
Longitudinal in vivo DXA measurements in aged F344BN rats show bone mineral density (BMD) changes over 18 weeks at multiple sites. Slight losses of BMD in normonatremic rats were as expected for this ageing phenotype. Chronic hyponatremia induced marked and progressive decreases of BMD that significantly exceeded the decrease in the normonatremic rats. Asterisks indicate first statistically significant change of BMD from baseline. Arrows indicate start of vitamin D injections. All data are means ± SEM
Fig. 2
Fig. 2
Changes of bone mineral density (BMD) at multiple sites at the end of Phase I (10 weeks) and Phase II (18 weeks) in normonatremic (open bars) and hyponatremic (black bars) aged F344BN rats. The rate of BMD decreases from baseline were significantly faster in the hyponatremic rats than in the normonatremic rats (p < 0.001). During Phase II, hyponatremic rats received high dose vitamin D supplement that mitigated further declines of BMD. Asterisks indicate statistically significant differences from the normonatremic controls. All data are means ± SEM
Fig. 3
Fig. 3
Parameters of calcium metabolism. Graphs show serum calcium, 25-hydroxy- vitamin D (25OHD), alkaline phosphatase (bone turnover marker) and osteocalcin (bone formation marker) values in normonatremic (open bars) and hyponatremic (black bars) aged F344BN rats at the end of Phase I and Phase II of the study. Results indicate that chronic hyponatremia reduced serum calcium and 25OHD levels, and that a 10-fold increased vitamin D supplementation during Phase II was needed to normalize calcium and 25OHD levels. Serum alkaline phosphatase concentrations were increased regardless of vitamin D status in the hyponatremic rats compared to the normonatremic rats, consistent with ersistently increased bone resorption to liberate sodium from the bone matrix. Reduced osteocalcin in Phase I indicated decreased bone formation, which returned to the levels of the normonatremic rats following vitamin D supplementation in Phase II. Asterisks indicate statistically significant differences from normonatremic controls (p < 0.05). All data are means ± SEM
Fig. 4
Fig. 4
Serum-free testosterone and gonadotropin concentrations and testicular weight in normonatremic (open bars) and hyponatremic (black bars) aged F344BN rats at the conclusion of the study. Graphs show that hyponatremic rats had slightly reduced free testosterone (NS) and increased FSH and LH concentrations compared to normonatremic rats. Hypogonadism was also indicated by reduced testes weights at autopsy. Asterisks indicate statistically significant differences from the normonatremic controls (p < 0.001). All data are means ± SEM
Fig. 5
Fig. 5
Histological appearance and morphometric analysis of testes sections from aged F344BN normonatremic and hyponatremic rats. Representative low-power (×20; upper panels) and high power (×40; lower panels) microscopic images of 5-μm sections stained with Masson’s trichrome protocol that marks collagen fibers with blue color. Images from normonatremic rat testes sections (left panel) show an intact spermatogenesis from the basal layer of spermatogonia, large primary spermatocytes and spermatids in a columnar patter, and a thin collagen layer surrounding blood vessels and in the lamina propria around the seminiferous tubules. In contrast, images from hyponatremic rat testes sections (right panels) demonstrate markedly reduced size of the seminiferous tubules with severely impaired spermatogenesis, disorganized basal layer, lack of columnar structure, absence of mature spermatozoa, necrosis and hyalinization in the center, and a thicker layer of collagen surrounding blood vessels and in the lamina propria of the seminiferous tubules. Bars, 100 μm. The graphs show results of morphometric analyses of images from normonatremic (open bar) and hyponatremic (black bars) rat testes, as described in the “Methods” section. The results indicate significant differences in seminiferous tubule size and peritubular and perivascular collagen deposits between the normonatremic and hyponatremic groups. Asterisks indicate statistically significant differences from normonatremic controls (p < 0.001). All data are means ± SEM
Fig. 6
Fig. 6
DXA measurements of thigh muscle mass in normonatremic and hyponatremic aged F344BN rats. On the left, values show percent changes of muscle mass measured in grams from the same region of interest from the beginning of the study (baseline) to the end of Phase I and Phase II of the study in normonatremic (open bars) and hyponatremic (black bars) rats. On the right, longitudinal in vivo DXA lean mass values are depicted in normonatremic (open label and gray line) and hyponatremic (closed label and black line) rats over the 18 weeks of study. The results indicate that hyponatremia induced marked sarcopenia that was mitigated by the normalization of vitamin D status during Phase II. Asterisks indicate statistically significant differences from normonatremic controls (p < 0.01). All data are means ± SEM
Fig. 7
Fig. 7
Histology and morphometric measurements of hearts from normonatremic and hyponatremic aged F344BN rats. Representative low-power (×20 objective; upper panels) and high power (×40 objective; lower panels) microscopic images of 5-μm sections from the hearts stained with Masson’s trichrome protocol that marks collagen fibers with blue color. Note increased interstitial and perivascular collagen deposits in micrographs of the left ventricle from hyponatremic rats (right panels) compared to micrographs from normonatremic rats (left panels). Bars, 100 μm

Similar articles

Cited by

References

    1. Almeida M, Han L, Martin-Millan M, Plotkin LI, Stewart SA, Roberson PK, Kousteni S, O'Brien CA, Bellido T, Parfitt AM, Weinstein RS, Jilka RL, Manolagas SC. Skeletal involution by age-associated oxidative stress and its acceleration by loss of sex steroids. J Biol Chem. 2007;282:27285–27297. doi: 10.1074/jbc.M702810200. - DOI - PMC - PubMed
    1. Baker DJ, Hepple RT. Elevated caspase and AIF gene expression correlate with progression of sarcopenia during aging in male F344BN rats. Exp Gerontol. 2006;41:1149–1156. doi: 10.1016/j.exger.2006.08.007. - DOI - PubMed
    1. Barsony J, Sugimura Y, Verbalis JG (2010) Osteoclast response to low extracellular sodium and the mechanism of hyponatremia-induced bone loss. J Biol Chem 286(12):10864–10875 - PMC - PubMed
    1. Bergstrom WH, Wallace WM. Bone as a sodium and potassium reservoir. J Clin Invest. 1954;33:867–873. doi: 10.1172/JCI102959. - DOI - PMC - PubMed
    1. Bhasin S. Testosterone supplementation for aging-associated sarcopenia. J Gerontol A Biol Sci Med Sci. 2003;58:1002–1008. doi: 10.1093/gerona/58.11.M1002. - DOI - PubMed

Publication types

MeSH terms