. 2012 Apr;107(7):1881-9.
doi: 10.1152/jn.00715.2011. Epub 2012 Jan 4.

Contribution of axonal orientation to pathway-dependent modulation of excitatory transmission by direct current stimulation in isolated rat hippocampus

Affiliations

Contribution of axonal orientation to pathway-dependent modulation of excitatory transmission by direct current stimulation in isolated rat hippocampus

Anatoli Y Kabakov et al. J Neurophysiol. 2012 Apr.

Abstract

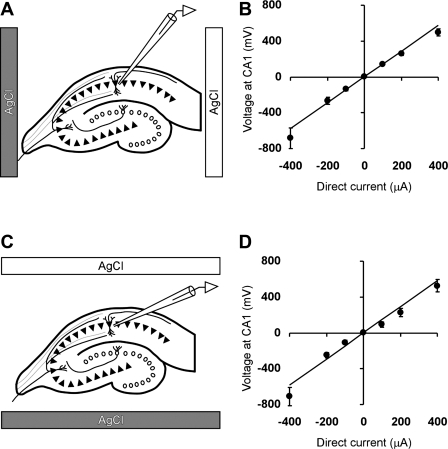
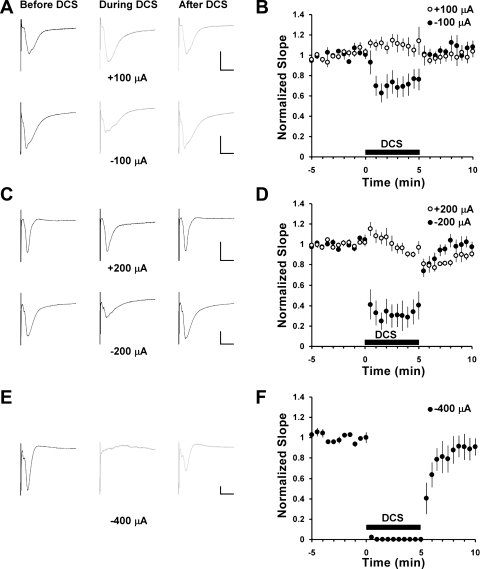
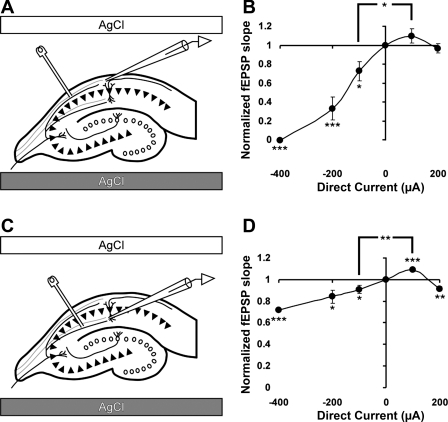
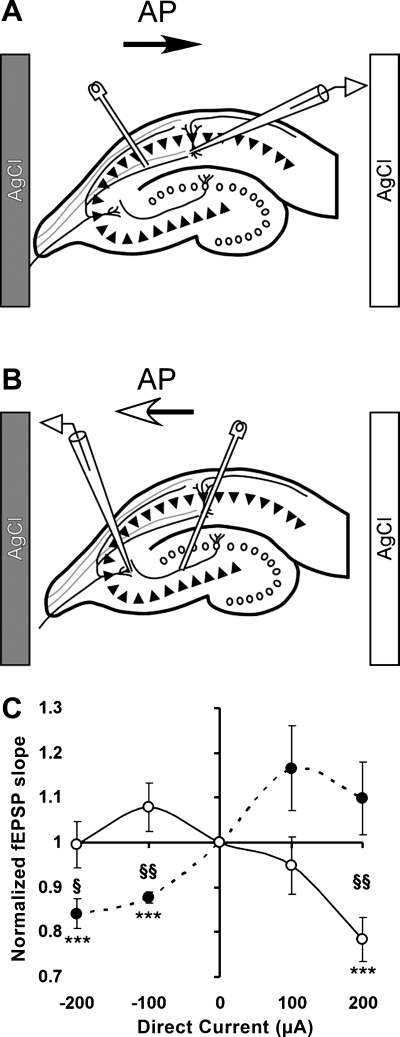
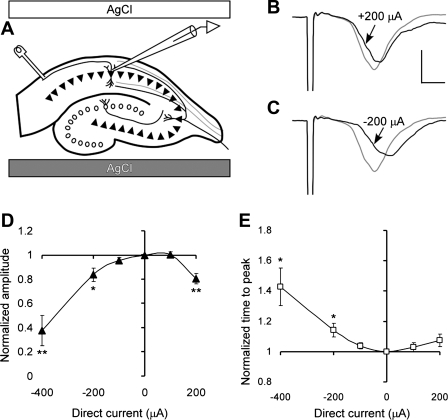
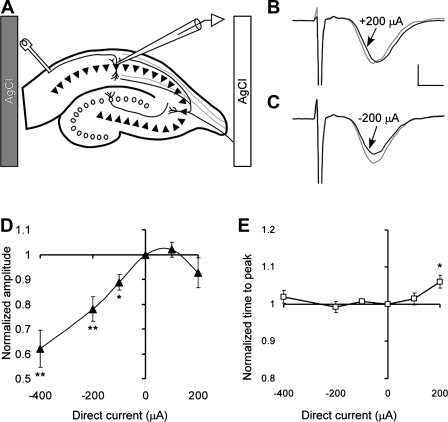
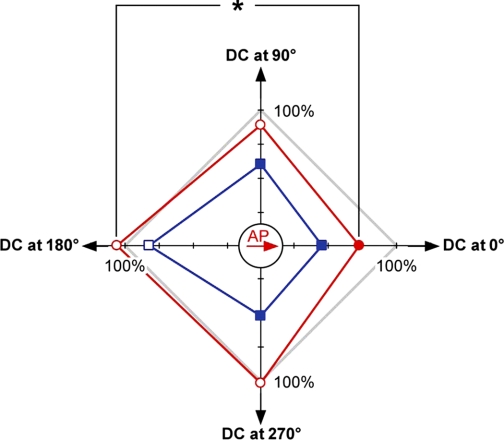
Transcranial direct current stimulation (tDCS) is a method for modulating cortical excitability by weak constant electrical current that is applied through scalp electrodes. Although often described in terms of anodal or cathodal stimulation, depending on which scalp electrode pole is proximal to the cortical region of interest, it is the orientation of neuronal structures relative to the direct current (DC) vector that determines the effect of tDCS. To investigate the contribution of neural pathway orientation, we studied DCS-mediated neuromodulation in an in vitro rat hippocampal slice preparation. We examined the contribution of dendritic orientation to the direct current stimulation (DCS) neuromodulatory effect by recording field excitatory postsynaptic potentials (fEPSPs) in apical and basal dendrites of CA1 neurons within a constant DC field. In addition, we assessed the contribution of axonal orientation by recording CA1 and CA3 apical fEPSPs generated by stimulation of oppositely oriented Schaffer collateral and mossy fiber axons, respectively, during DCS. Finally, nonsynaptic excitatory signal propagation was measured along antidromically stimulated CA1 axons at different DCS amplitudes and polarity. We find that modulation of both the fEPSP and population spike depends on axonal orientation relative to the electric field vector. Axonal orientation determines whether the DC field is excitatory or inhibitory and dendritic orientation affects the magnitude, but not the overall direction, of the DC effect. These data suggest that tDCS may oppositely affect neurons in a stimulated cortical volume if these neurons are excited by oppositely orientated axons in a constant electrical field.


Figures

Fig. 1.
Fig. 1.
Voltage inside CA1 layer nearly linearly depends on direct current (DC) amplitude. A and C: position of the recording electrode in CA1 region and positions of two DC silver-chloride (AgCl) electrodes in “horizontal” and “vertical” configurations, respectively. B and D: dependence of the voltage in CA1 region measured relative to the “gray” AgCl electrode as a function of the DC amplitude. Positive DC values correspond to positive potential of “white” DC electrode relative to gray DC electrode. Number of slices per condition is 6 or 7. Error bars correspond to SE.
Fig. 2.
Fig. 2.
Cathodal and not anodal direct current stimulation (DCS) significantly inhibits field excitatory postsynaptic potentials (fEPSPs) in the basal dendrites of CA1 neurons evoked by stimulation of association fibers in stratum oriens. A, C, and E: representative fEPSP recordings (averages of 7 consecutive traces) before (left), during (middle), and after (right) DCS at 100, 200, and 400 μA, respectively. DCS polarity was defined as the polarity of white DCS electrode relatively to gray electrode as shown in Fig. 1. The scaling bars correspond to 500 μV and 10 ms. B, D, and F: time courses of average values normalized to the baseline fEPSP slopes. DCS starts at time 0 and ends after 5 min as shown by the filled bars. Open circles correspond to positive (anodal) DCS, and filled circles correspond to negative (cathodal) DCS. Numbers of slices per experiment are equal to 4, 6, 6, 7, and 8 for −400, −200, −100, +100, and +200 μA of DCS, respectively. Error bars correspond to SE.
Fig. 3.
Fig. 3.
DCS has similar effects on evoked fEPSPs in both basal and apical dendrites of CA1 neurons. A and C: positions of the DCS electrodes. Stimulating platinum-iridium (Pt-Ir) electrode is positioned at association fibers in stratum oriens in A and at Schaffer collaterals in C. The recording glass electrodes are positioned at basal or apical CA1 dendrites, respectively. B: the cumulative data based on the results shown in Fig. 2 reveal significant inhibition of fEPSPs in basal CA1 dendrites in all studied amplitudes of cathodal DCS. Values of fEPSP slope are 0, 33 ± 12, 75 ± 10, 110 ± 8, and 97 ± 5% for DCS of −400, −200, −100, +100, and +200 μA DCS, respectively. One-way ANOVA demonstrate significant dependence of average fEPSP slope on the DCS condition F(4,26) = 25.6; P = 0.0001. D: cathodal DCS also inhibits fEPSPs at apical dendrites of CA1 neurons. However, anodal DCS facilitates apical fEPSPs at 100 μA, but further increase in anodal DCS leads to inhibition of the fEPSPs. Values of fEPSP slope are 72 ± 1, 84 ± 6, 91 ± 4, 109 ± 2, and 91 ± 2% for DCS of −400, −200, −100, +100, and +200 μA, respectively. One-way ANOVA demonstrate significant dependence of average fEPSP slope on the DCS condition F(4,22) = 7.77; P = 0.0005. Numbers of slices are 3, 5, 10, 5, and 4 for −400, −200, −100, +100, and +200 μA of DCS, respectively. *P < 0.05, **P < 0.01, and ***P < 0.001.
Fig. 4.
Fig. 4.
DCS has opposite effects on fEPSP facilitation and paired-pulse facilitation (PPF) in CA1 apical synapses in electrodes' configuration shown in Fig. 3C. A: typically, cathodal DCS inhibits first fEPSP and increases the PPF ratio. B: anodal DCS facilitates first fEPSP but reduces the PPF ratio. In both cases, fEPSPs are in gray color before DCS and in black during DCS. fEPSPs after DCS were similar to those before DCS, as shown in Fig. 2, and they were omitted for clarity. The scaling bars are 500 µV and 10 ms, respectively. C: scatter plot and the best fit of the relationship between the changes in normalized PPF ratios and in changes in normalized fEPSPs caused by −200, −100, +100, or +200 μA DCS. PPF ratios during DCS were normalized to PPF ratios before DCS. In the absence of DCS, both normalized PPF ratios and normalized fEPSPs were equal to 1. Linear fit of the relationship in 8 hippocampal slices reveals significant negative correlation with a slope of −0.26 ± 0.03 (P < 0.001), which is in agreement with a presynaptic effect of DCS.
Fig. 5.
Fig. 5.
DCS effect on fEPSPs in apical CA1 and CA3 dendrites depends on the direction of efferent action potential (AP) propagation vector. A and B: positions of the DCS electrodes and approximate directions of the vectors of AP in Schaffer collaterals (black head arrow) and in mossy fibers (white head arrow). Stimulating Pt-Ir electrode is positioned at Schaffer collaterals in A and at mossy fibers in B. The recording glass electrodes are positioned at apical CA1 and apical CA3 dendrites. Numbers of slices for CA1 fEPSPs (in configuration A) are 6, 6, 5, and 6 for −200, −100, +100, and +200 μA of DCS, respectively. Numbers of slices for CA3 fEPSPs (in configuration B) are 7, 6, 7, and 7 for −200, −100, +100, and +200 μA of DCS, respectively. C: effect of DCS on fEPSPs at apical dendrite CA1 neurons (filled circles) is opposite to the effect on fEPSPs at apical dendrite CA3 neurons (open circles). Values of fEPSP slope for CA1 region are 84 ± 3, 88 ± 1, 117 ± 9, and 110 ± 8% for DCS of −200, −100, +100, and +200 μA, respectively. One-way ANOVA confirms significant fEPSP dependence on the DCS condition F(3,19) = 6.78; P < 0.003. Values of fEPSP slope for CA3 region are 78 ± 5, 95 ± 6, 108 ± 5, and 99 ± 5% for DCS of −200, −100, +100, and +200 μA, respectively. As above, one-way ANOVA demonstrates significant contribution of the DCS condition to the fEPSP slope, F(3,20) = 7.09; P = 0.002. ***P < 0.001, difference from baseline. §P < 0.05 and §§P < 0.01, difference between CA1 and CA3 responses to DCS.
Fig. 6.
Fig. 6.
Effect of DCS on population spikes in CA1 neurons stimulated antidromically when DCS current is approximately orthogonal to AP propagation. A: positions of DCS electrodes; Pt-Ir stimulating electrode is touching alveus, and tip of the glass recording electrode is in the CA1 layer. B and C: representative CA1 population spikes before (gray line) and during (black line) 200 μA of anodal and cathodal DCS, respectively. The scaling bars represent 1 mV and 1 ms, respectively. D: effect of DCS on normalized amplitude of the population spikes. Values of the spike amplitude are 38 ± 12, 84 ± 6, 95 ± 2, 100 ± 2, and 81 ± 4% for DCS of −400, −200, −100, +100, and +200 μA, respectively. One-way ANOVA demonstrate significant dependence spike amplitude on the DCS condition, F(4,27) = 14.6 and for P < 0.0001. Numbers of the slices per condition are 6, 7, 6, 7, and 6, respectively. E: effect of DCS on normalized time interval between the stimulus and the population spike. *P < 0.05 and **P < 0.01.
Fig. 7.
Fig. 7.
Effect of DCS on population spikes in CA1 neurons stimulated antidromically when DCS current is approximately parallel or antiparallel to AP propagation. A: positions of the electrodes. B andC: representative CA1 population spikes before (gray line) and during (black line) 200 μA of anodal and cathodal DCS, respectively. The scaling bars represent 1 mV and 1 ms, respectively. D: effect of DCS on normalized amplitude of the population spikes. Values of the spike amplitude are 62 ± 7, 78 ± 5, 89 ± 3, 102 ± 3, and 93 ± 6% for DCS of −400, −200, −100, +100, and +200 μA, respectively. One-way ANOVA demonstrate significant dependence spike amplitude on the DCS condition, F(4,23) = 8.8; P = 0.0002. Numbers of the slices per condition are 6, 6, 5, 6, and 5, respectively. E: effect of DCS on normalized time interval between the stimulus and the population spike. *P < 0.05 and **P < 0.01.
Fig. 8.
Fig. 8.
Effect of DCS on CA1 population spike evoked by antidromic stimulation of CA1 neurons depends on the relative orientation of the DC current vector and the vector of the (AP) propagation. The diagram shows amplitudes of normalized amplitudes from Figs. 6D and 7D before DCS in gray (100%) and during 100- and 200-μA DCS as red circles and blue squares, respectively. The direction of the AP vector is shown as the red arrow in the origin (corresponding to 60%), and the directions of the DC current correspond to the back arrows at the ends of the axes (with ticks spaced at 10%). Filled circles and squares correspond to statistically significant effects on the amplitude. Open symbols correspond to nonsignificant variations. *P < 0.05 between the effects of 100-μA DC parallel and antiparallel to the AP propagation vector. Note that DCS always inhibits fEPSP when the vector projection of the AP propagation in the direction of the DC current is positive.

References

    1. Antal A, Kriener N, Lang N, Boros K, Paulus W. Cathodal transcranial direct current stimulation of the visual cortex in the prophylactic treatment of migraine. Cephalalgia 31: 820–828, 2011 - PubMed
    1. Bikson M, Inoue M, Akiyama H, Deans JK, Fox JE, Miyakawa H, Jefferys JG. Effects of uniform extracellular DC electric fields on excitability in rat hippocampal slices in vitro. J Physiol 557: 175–190, 2004 - PMC - PubMed
    1. Bindman LJ, Lippold OC, Redfearn JW. The action of brief polarizing currents on the cerebral cortex of the rat (1) during current flow and (2) in the production of long-lasting after-effects. J Physiol 172: 369–382, 1964 - PMC - PubMed
    1. Brunoni AR, Ferrucci R, Bortolomasi M, Vergari M, Tadini L, Boggio PS, Giacopuzzi M, Barbieri S, Priori A. Transcranial direct current stimulation (tDCS) in unipolar vs. bipolar depressive disorder. Prog Neuropsychopharmacol Biol Psychiatry 35: 96–101 - PubMed
    1. Buckmaster PS, Wong EH. Evoked responses of the dentate gyrus during seizures in developing gerbils with inherited epilepsy. J Neurophysiol 88: 783–793, 2002 - PubMed

Publication types

LinkOut - more resources