. 2012 Feb 23;119(8):e57-66.
doi: 10.1182/blood-2011-09-380048. Epub 2012 Jan 4.

A rapid diagnostic test for human regulatory T-cell function to enable regulatory T-cell therapy

Affiliations

A rapid diagnostic test for human regulatory T-cell function to enable regulatory T-cell therapy

James B Canavan et al. Blood. .

Abstract

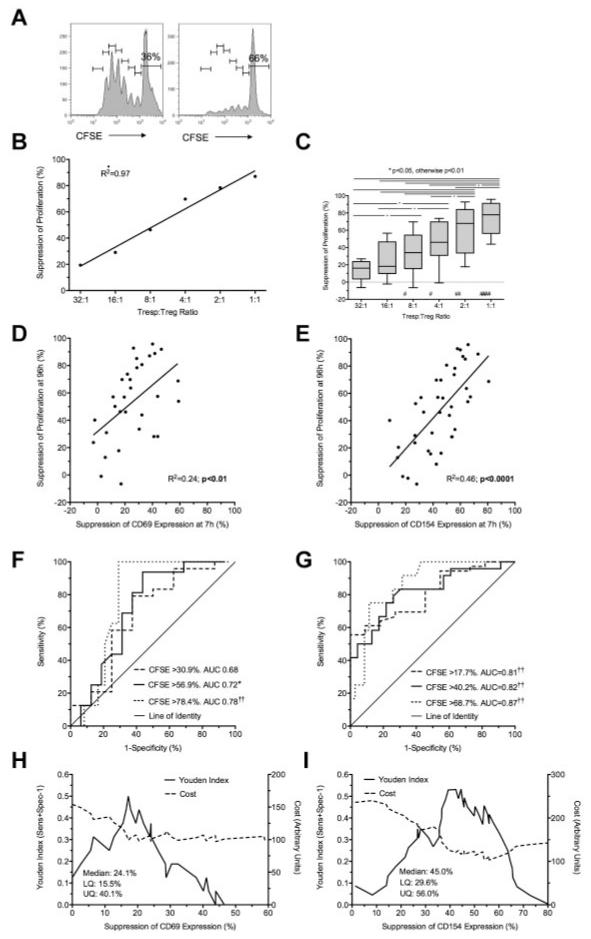
Regulatory T cells (CD4(+)CD25(hi)CD127(lo)FOXP3(+) T cells [Tregs]) are a population of lymphocytes involved in the maintenance of self-tolerance. Abnormalities in function or number of Tregs are a feature of autoimmune diseases in humans. The ability to expand functional Tregs ex vivo makes them ideal candidates for autologous cell therapy to treat human autoimmune diseases and to induce tolerance to transplants. Current tests of Treg function typically take up to 120 hours, a kinetic disadvantage as clinical trials of Tregs will be critically dependent on the availability of rapid diagnostic tests before infusion into humans. Here we evaluate a 7-hour flow cytometric assay for assessing Treg function, using suppression of the activation markers CD69 and CD154 on responder T cells (CD4(+)CD25(-) [Tresp]), compared with traditional assays involving inhibition of CFSE dilution and cytokine production. In both freshly isolated and ex vivo expanded Tregs, we describe excellent correlation with gold standard suppressor cell assays. We propose that the kinetic advantage of the new assay may place it as the preferred rapid diagnostic test for the evaluation of Treg function in forthcoming clinical trials of cell therapy, enabling the translation of the large body of preclinical data into potentially useful treatments for human diseases.


Figures

Figure 1
Figure 1. Suppression of CD69 and CD154 expression on Tresps by autologous freshly isolated Tregs
(A-B) Representative examples of CD69 and CD154 expression on Tresps either cultured alone (A) or cocultured with Tregs (B, here at a 1:1 Tresp:Treg ratio). (C-D) Box-and-whisker plots of pooled data from 10 independent experiments. (E,G) Percentage suppression of CD69 and CD154 on Tresps by Tregs showing a representative experiment (E) and box-and-whisker plots (F-G) of pooled data from 10 independent experiments. *P < .05, **P < .01, ***P < .001. †P < .05, ††P < .001 with respect to Tresp alone cultures (Tresp:Treg ratio of 1:0).
Figure 2
Figure 2. Suppression at 7 hours predicts suppression of proliferation at 96 hours
(A) Representative example of a 96-hour CFSE dilution assay, gated on live Tresps, cultured alone (left) or at a 1:1 Tresp:Treg ratio (right). (B-C) Suppression of proliferation at 96 hours at increasing Tresp/Treg ratios from a representative experiment (B) and pooled data from 10 independent experiments (C). (D-E) Comparison of suppression of CD69 (D) and CD154 (E) expression at 7 hours with paired suppression of autologous Tresp proliferation at 96 hours, with regression lines. (F-G) ROC curves illustrating the performance of CD69 suppression (F) and CD154 suppression (G) at correctly identifying suppression of Tresp proliferation at 96 hours, for 3 critical values of the CFSE dilution assay. (H-I) Performance of CD69 (H) and CD154 suppression (I) at correctly identifying median suppression of proliferation. Median and distribution statistics for each marker are also given. The left and right y-axes illustrate the Youden index for threshold values and arbitrary cost of threshold values, penalizing for false positives, respectively. (D-I) Pooled data from Tresp/Treg ratios 4:1 to 1:1 from 10 independent experiments. *P < .05, **P < .01, ***P < .001, †P < .005, ††P < .0001. UQ indicates upper quartile; and LQ, lower quartile. #P < .005, ##P < .0001 with respect to Tresp alone cultures (Tresp:Treg ratio of 1:0).
Figure 3
Figure 3. Suppression of CD69 and CD154 expression on Tresps by ex vivo expanded Tregs
(A-B) Representative examples of CD69 and CD154 expression on Tresps either cultured alone (A) or cocultured with ex vivo expanded Tregs (B, here at a 1:1 Tresp:Treg ratio). (C-E) Percentage suppression of CD69 and CD154 expression on Tresps by Tregs, showing a representative experiment (C) and box-and-whisker plots of pooled data from 8 independent experiments (D-E). Please note that the regression line for CD69 extends only from the 8:1 to 1:1 conditions as suppression was barely visible below the 4:1 ratio. **P < .01. †P < .05, ††P < .001, †††P < .0001 with respect to Tresp alone cultures (Tresp:Treg ratio of 1:0).
Figure 4
Figure 4. Suppression at 7 hours by ex vivo expanded Tregs predicts suppression of proliferation at 96 hours
(A) Representative example of a CFSE dilution assay showing Tregs cultured alone (left) or in coculture with Tregs at 1:1 Tresp:Treg ratio (right). (B-C) Suppression of proliferation at 96 hours at increasing Tresp:Treg ratios, showing a representative experiment (B) and pooled data from 8 independent experiments (C). (D-E) Comparison of suppression of CD69 (D) and CD154 (E) expression at 7 hours with paired suppression of Tresp proliferation at 96 hours, with regression lines. (F-G) ROC curves illustrating performance of CD69 (F) and CD154 suppression (G) at correctly identifying suppression of Tresp proliferation at 96 hours, for 3 critical values of the CFSE dilution assay. (H-I) Graphs illustrating the performance of CD69 (H) and CD154 suppression (I) at correctly identifying median suppression of proliferation. Median and distribution statistics for each marker are also given. The left and right y-axes illustrate the Youden index for threshold values and arbitrary cost of threshold values, penalizing for false positives, respectively. (C-I) Pooled data from 8 independent experiments from Tresp:Treg ratios 8:1 to 1:1 for CD69 and 16:1 to 1:1 for CD154. *P < .05, ††P < .0001. #P < .05, ##P < .01, ###P < .0001 with respect to Tresp alone cultures (Tresp:Treg ratio of 1:0).
Figure 5
Figure 5. Suppression of cytokine production at 96 hours is predicable at 7 hours
(A) Absolute concentrations of IL-2 and IFN-γ in 96-hour supernatants of Tresps cultured alone or together with freshly isolated or GMP-Tregs at various ratios. (B) Suppression of IL-2 and IFN-γ in supernatants by Tregs. (C) Relationship between suppression of CD69 and CD154 expression at 7 hours and inhibition of IL-2 and IFN-γ at 96 hours. (A-C) Cumulative data from 4 independent experiments with each type of Treg showing freshly isolated Tregs (left panels) and GMP-Tregs (right panels). *P < .05, **P < .01, ***P < .001, ****P < .0001. †P < .05, ††P < .01, †††P < .001, and ††††P < .001 with respect to Tresp alone cultures (Tresp:Treg ratio of 1:0).

Similar articles

Cited by

  • Treatment of graft-versus-host disease with naturally occurring T regulatory cells.
    Trzonkowski P, Dukat-Mazurek A, Bieniaszewska M, Marek-Trzonkowska N, Dobyszuk A, Juścińska J, Dutka M, Myśliwska J, Hellmann A. Trzonkowski P, et al. BioDrugs. 2013 Dec;27(6):605-14. doi: 10.1007/s40259-013-0050-5. BioDrugs. 2013. PMID: 23813436 Free PMC article. Review.
  • Regulatory T Cells in Respiratory Health and Diseases.
    Singh R, Alape D, de Lima A, Ascanio J, Majid A, Gangadharan SP. Singh R, et al. Pulm Med. 2019 Nov 20;2019:1907807. doi: 10.1155/2019/1907807. eCollection 2019. Pulm Med. 2019. PMID: 31827925 Free PMC article. Review.
  • Isolation of biologically-active exosomes from human plasma.
    Muller L, Hong CS, Stolz DB, Watkins SC, Whiteside TL. Muller L, et al. J Immunol Methods. 2014 Sep;411:55-65. doi: 10.1016/j.jim.2014.06.007. Epub 2014 Jun 18. J Immunol Methods. 2014. PMID: 24952243 Free PMC article. Clinical Trial.
  • Monitoring T cell alloreactivity.
    Mehrotra A, Leventhal J, Purroy C, Cravedi P. Mehrotra A, et al. Transplant Rev (Orlando). 2015 Apr;29(2):53-9. doi: 10.1016/j.trre.2014.11.001. Epub 2014 Nov 12. Transplant Rev (Orlando). 2015. PMID: 25475045 Free PMC article. Review.
  • Induced and natural regulatory T cells in human cancer.
    Whiteside TL, Schuler P, Schilling B. Whiteside TL, et al. Expert Opin Biol Ther. 2012 Oct;12(10):1383-97. doi: 10.1517/14712598.2012.707184. Epub 2012 Jul 31. Expert Opin Biol Ther. 2012. PMID: 22849383 Free PMC article. Review.

References

    1. Afzali B, Lombardi G, Lechler RI, Lord GM. The role of T helper 17 (Th17) and regulatory T cells (Treg) in human organ transplantation and auto-immune disease. Clin Exp Immunol. 2007;148(1):32–46. - PMC - PubMed
    1. Atalar K, Afzali B, Lord G, Lombardi G. Relative roles of Th1 and Th17 effector cells in allograft rejection. Curr Opin Organ Transplant. 2009;14(1):23–29. - PubMed
    1. Baecher-Allan C, Hafler DA. Human regulatory T cells and their role in autoimmune disease. Immunol Rev. 2006;212:203–216. - PubMed
    1. Viglietta V, Baecher-Allan C, Weiner HL, Hafler DA. Loss of functional suppression by CD4+CD25+ regulatory T cells in patients with multiple sclerosis. J Exp Med. 2004;199(7):971–979. - PMC - PubMed
    1. Lindley S, Dayan CM, Bishop A, Roep BO, Peakman M, Tree TI. Defective suppressor function in CD4(+)CD25(+) T-cells from patients with type 1 diabetes. Diabetes. 2005;54(1):92–99. - PubMed

Publication types

MeSH terms