. 2012 Jan 4;32(1):68-84.
doi: 10.1523/JNEUROSCI.3215-11.2012.

Endogenous Rho-kinase signaling maintains synaptic strength by stabilizing the size of the readily releasable pool of synaptic vesicles

Affiliations

Endogenous Rho-kinase signaling maintains synaptic strength by stabilizing the size of the readily releasable pool of synaptic vesicles

David González-Forero et al. J Neurosci. .

Abstract

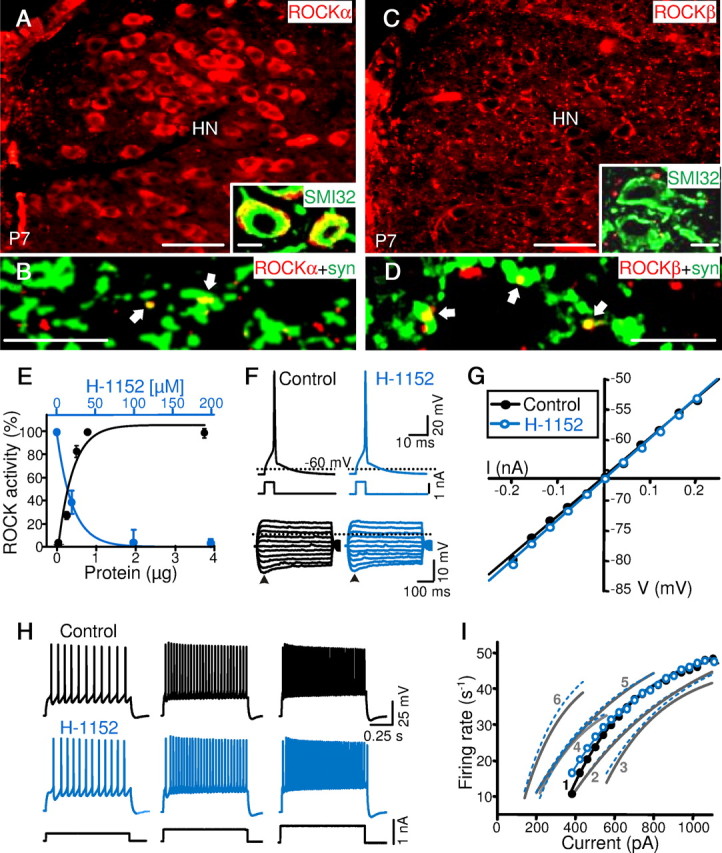
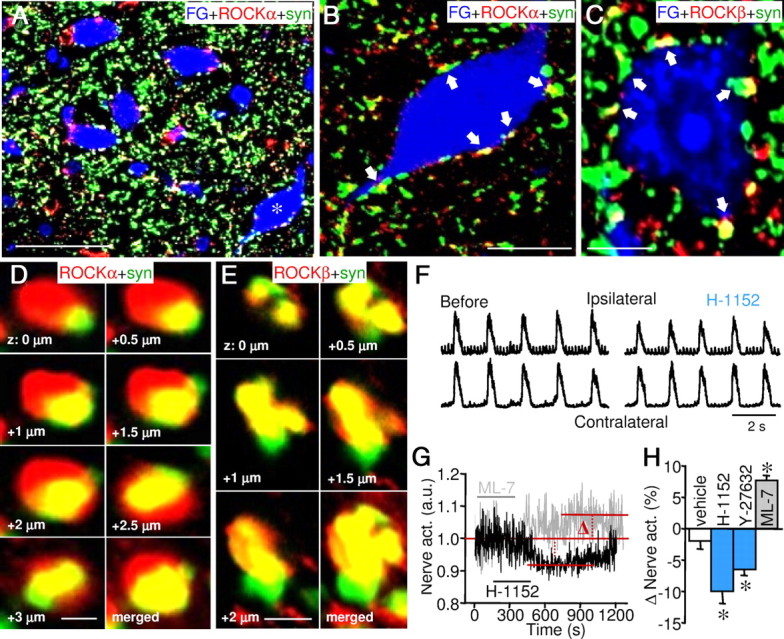
Rho-associated kinase (ROCK) regulates neural cell migration, proliferation and survival, dendritic spine morphology, and axon guidance and regeneration. There is, however, little information about whether ROCK modulates the electrical activity and information processing of neuronal circuits. At neonatal stage, ROCKα is expressed in hypoglossal motoneurons (HMNs) and in their afferent inputs, whereas ROCKβ is found in synaptic terminals on HMNs, but not in their somata. Inhibition of endogenous ROCK activity in neonatal rat brainstem slices failed to modulate intrinsic excitability of HMNs, but strongly attenuated the strength of their glutamatergic and GABAergic synaptic inputs. The mechanism acts presynaptically to reduce evoked neurotransmitter release. ROCK inhibition increased myosin light chain (MLC) phosphorylation, which is known to trigger actomyosin contraction, and reduced the number of synaptic vesicles docked to active zones in excitatory boutons. Functional and ultrastructural changes induced by ROCK inhibition were fully prevented/reverted by MLC kinase (MLCK) inhibition. Furthermore, ROCK inhibition drastically reduced the phosphorylated form of p21-associated kinase (PAK), which directly inhibits MLCK. We conclude that endogenous ROCK activity is necessary for the normal performance of motor output commands, because it maintains afferent synaptic strength, by stabilizing the size of the readily releasable pool of synaptic vesicles. The mechanism of action involves a tonic inhibition of MLCK, presumably through PAK phosphorylation. This mechanism might be present in adults since unilateral microinjection of ROCK or MLCK inhibitors into the hypoglossal nucleus reduced or increased, respectively, whole XIIth nerve activity.


Figures

Figure 1.
Figure 1.
Inhibition of ROCK signaling had no effects on intrinsic excitability of HMNs. A–D, Low-magnification epifluorescence images showing the overall expression pattern of the two ROCK isoforms, ROCKα (A) and ROCKβ (C), in the HN from neonatal (P7) rats. Double-labeling confocal immunofluorescence for the synaptic marker synaptophysin (syn; green) and ROCKα (B) or ROCK β (D) isoforms. Arrows indicate examples of colocalization of syn and ROCKα or β. Insets, Double-labeling confocal immunofluorescence for the motoneuron marker SMI32 (green) and ROCKα (A) or ROCK β (C) isoforms (red). Scale bars: A, C, 100 μm; B, D, and insets, 10 μm. E, ROCK activity relative to total protein content (black) and concentration of the ROCK inhibitor H-1152 (blue) determined in HN homogenates from neonatal rat pups. Each point represents the average from three independent assays. F, Top traces, comparison of the voltage responses to identical depolarizing current pulses of threshold intensity obtained in an HMN before (control) and 10 min after adding 20 μm the ROCK inhibitor to the bath (H-1152). Bottom traces, Subthreshold voltage responses of the same HMN to negative and positive current pulses (0.5 s duration, 0.04 nA increments) under the specified recording conditions. Dotted lines indicate −60 mV and arrowheads the time point used to measure the peak voltage response. G, V–I relationships for the traces shown in F. RN was determined by the slope of the regression line through the V–I plot. The calculated RN for the HMN was 64.5 MΩ in control conditions and 66.9 MΩ after drug perfusion. H, Repetitive firing of an HMN for three current steps of increasing amplitude before (control) and after superfusion with H-1152. I, Plot of mean f–I relationship for the HMN shown in H in control conditions (dots) and in the presence of H-1152 (circles). A collection of exponential regression lines for five additional HMNs (denoted by numbers) obtained before (solid gray lines) and after H-1152 treatment (dashed blue lines) are displayed in the graph as well.
Figure 2.
Figure 2.
Pharmacologic inhibition of basal ROCK strongly reduces the amplitude of the AMPAergic component of the EPSCs in HMNs. A, Left, schematic diagram of the in vitro experimental model used to analyze the effects of pharmacologic inhibition of ROCK activity on synaptic transmission to HMNs. Whole-cell patch-clamp recordings (Rec) were obtained from somata of large HN neurons in neonatal brainstem slices. EPSCs were evoked by electrical stimulation (Stim) of the ventrolateral reticular formation (VLRF). Right, Pharmacological dissection of postsynaptic currents evoked in HMNs by electrical stimulation of the VLRF. Cells were voltage-clamped at −65 mV. Addition of glutamate receptor blockers (20 μm NBQX + 50 μm APV) reduced by >90% the full current peak amplitude. The remaining residual current was partially abolished with GABAA- and glycine-receptor antagonists (10 μm bicuculline + 1 μm strychnine). B, Representative examples of pharmacologically isolated eEPSCsAMPA from HMNs recorded before (black), following a 10 min exposure to H-1152 or Y-27632 (blue), and after 10 min of wash with drug-free solution (red). C, Summary data showing the changes in eEPSCsAMPA peak amplitude induced by H-1152 (n = 6) and Y-27632 (n = 7). *p < 0.05, one-way ANOVA for repeated measures.
Figure 3.
Figure 3.
ROCK inhibition does not affect the sensitivity of the postsynaptic membrane to quantally released or exogenously applied glutamate. A, Traces of spontaneously occurring mEPSCsAMPA recorded from a representative HMN before and after 10 min bath perfusion with H-1152. The cell was held at −65 mV during recording. Quantal AMPAergic currents (mEPSCsAMPA) were isolated with tetrodotoxin (1 μm), bicuculline (10 μm), strychnine (1 μm), APV (50 μm), and d-tubocurarine (30 μm). B, Cumulative probability functions of mEPSCAMPA amplitudes pooled from 4 HMNs recorded under control conditions (black) and after treatment with H-1152 (blue). Bin width, 2 pA. C, Whole-cell AMPAergic currents evoked by 100 ms pressure pulses of glutamate (applied at saturating concentrations; 1 mm) in an HMN before (black) and after superfusion with H-1152 (blue). Recordings were performed at −65 mV in the presence of tetrodotoxin in nominally Ca2+-free solution. AMPAergic responses evoked by the glutamate pulse were pharmacologically isolated by bath application of bicuculline, strychnine, APV, and d-tubocurarine. Postsynaptic responsiveness to glutamate pulses was effectively (>95%) blocked with 20 μm AMPA receptor antagonist NBQX (green).
Figure 4.
Figure 4.
The mechanism underlying ROCK-dependent maintenance of synaptic strength operates presynaptically. A, Current traces of sEPSCsAMPA recorded from an HMN before (black), following treatment with H-1152 (blue), and after washing (red). sEPSCsAMPA were isolated in the presence of bicuculline, strychnine, APV, and d-tubocurarine and recorded at −65 mV in a high-K+, high-Ca2+ containing aCSF without tetrodotoxin. B, Average sEPSCAMPA amplitude for the H-1152-treated group of HMNs compared with their respective pretreatment (control) and washout periods (n = 6 HMNs). *p < 0.05, one-way ANOVA for repeated measures. C, Normalized cumulative probability distributions of sEPSCAMPA amplitudes measured for each condition (listed in the inset box). Bin width, 2 pA. D, Examples of eEPSCsAMPA recorded in response to paired-pulse stimulation of VLRF axons in an HMN before (black) and after treatment with H-1152 (blue), and after washing (red). Stimulus interval was 25 ms. The rightmost trace shows the superimposition of the responses scaled to the peak of the first eEPSCsAMPA. PPR was obtained from the amplitude of the first and second eEPSCsAMPA by the formula eEPSCsAMPA2/eEPSCsAMPA1. E, Comparison of PPR measured at interpulse intervals ranging from 25 to 200 ms for HMNs recorded before, during, and after washout of the drug (n = 5 HMNs). *p < 0.05, two-way ANOVA for repeated measures. F, Sample records illustrating succession of eEPSCsAMPA in an HMN evoked by a train of 20 stimuli at 40 Hz applied to the VLRF in normal aCSF (black) and 10 min after adding H-1152 (blue). Traces are scaled so that the first eEPSCsAMPA of train recorded under H-1152 treatment is equal in size to the first eEPSCsAMPA of train under control conditions. Facilitation index of eEPSCsAMPA throughout the train was calculated relative to the amplitude of first eEPSCsAMPA in the same train. G, Mean eEPSCsAMPA amplitude, normalized to the first eEPSCsAMPA (eEPSCsAMPAn/eEPSCsAMPA1) and plotted against the position number of eEPSCsAMPAn within the train (1–20) for the H-1152-treated group of HMNs under control, drug perfusion, and washout conditions (n = 6 HMNs). Symbol code listed in E, above. *p < 0.05, two-way ANOVA for repeated measures. H, Top, Representative examples showing superimposition of 10 successive eEPSCsAMPA evoked at 0.2 Hz by minimal stimulation of VLRF in an HMN before (black), after treatment with H-1152 (blue) and after washing (red). Bottom, Amplitude distribution histograms of eEPSCsAMPA in response to minimal stimulation before, during, and after H-1152 treatment. Arrows indicate mean values. Note the reversible shift of the distribution to the left under H-1152. Each histogram is made of 600 responses (5 pA bin size) pooled from 3 HMNs. I, Histogram showing changes in eEPSCsAMPA failure rates to minimal stimulation for the control, H-1152, and washout conditions. The fraction of events classified as failures was significantly increased by H-1152 (n = 3). *p < 0.05, one-way ANOVA on ranks for repeated measures.
Figure 5.
Figure 5.
Inhibition of endogenous ROCK activity increases p-MLC levels in the HN via a mechanism that involves MLCK activation and is accompanied by PAK dephosphorylation. A, Western blot of phosphorylated and total MLC protein levels (denoted as p-MLC and MLC, respectively) in the HN of neonatal brainstem slices incubated for 10 min in aCSF alone (control) or supplemented with either H-1152, 10 μm ML-7 or with H-1152 plus ML-7. α-Tubulin (α-tub) expression was used as an internal loading reference. B, Histogram showing the average ratio of p-MLC to total MLC densitometric intensity for the control and treated slices. Ratio values were normalized relative to the control group. Columns represent average of at least four independent experiments. *p < 0.05, one-way ANOVA on ranks, post hoc Dunn's test. C, Left traces, Examples of eEPSCsAMPA recorded from an HMN in normal aCSF (control; thick black) and after 10 min bath perfusion with ML-7 (thin black line). Right traces, eEPSCsAMPA recorded in an HMN before (thick black) and sequentially after adding to the bath H-1152 (gray) and then ML-7 (thin black line). D, Histogram showing quantitative comparison of average sEPSCAMPA amplitude for the ML-7 (n = 5) and H-1152 plus ML-7 (n = 4) treated groups of HMNs compared with their respective pretreatment controls (before). *p < 0.05, one-way ANOVA for repeated measures. E, Examples of eEPSCsAMPA evoked by paired-pulse stimulation of VLRF axons (interpulse interval 25 ms) in an HMN before (thick black) and following treatment with H-1152 (gray) and finally after coaddition of ML-7 (thin black). The rightmost trace shows the superimposition of the responses scaled to the peak of the first eEPSCsAMPA. F, Summary histogram of changes in PPR of eEPSCsAMPA measured in HMNs exposed sequentially to H-1152 and H-1152 plus ML-7 (n = 5) *p < 0.05, one-way ANOVA for repeated measures. G, Western blot analysis of p-PAK1–3 in HN homogenates from control and H-1152-treated brainstem slices. α-tub was used as loading reference.
Figure 6.
Figure 6.
ROCK inhibition reduces the size of the RRP of synaptic vesicles through a mechanism that involves MLCK activation. A, Triple-labeling confocal immunofluorescence for the motoneuron marker SMI32 (blue), the vesicular glutamate transporter 2 (VGLUT2; green), and ROCK (α and β isoforms; red) in a high-magnification image captured from a selected region of the HN from a neonatal (P7) rat. Yellow signals indicate the sites of colocalization of VGLUT2 and ROCKα/β. ROCK-ir clusters were found to be spatially contiguous or colocalizing with VGLUT2-ir terminals. Inset shows at higher magnification a z-stack reconstruction through the dashed box region. B, High-magnification confocal z-series showing straight relationship (top panels) between VGLUT2- and ROCKα/β-ir puncta and partial colocalization in the bottom panels. Scale bars: A, 25 μm; inset in A, 2 μm; B, 1 μm. C, D, Electron micrographs of two S-type boutons (containing spherical vesicles) with asymmetric synaptic contacts on the somatic membrane of an HMN depicting details of the procedure used to examine topographically the numerical changes in synaptic vesicles. The number of synaptic vesicles was counted in three zones, each 0.1 μm wide, parallel to the membrane of the synaptic cleft and at successively greater distances from the a.z. (C). The first region (boxed with a red dotted line) encloses an area directly adjacent to the a.z. membrane. The intermediate region (boxed with a blue dotted line) was located in the interval from 0.1 μm to 0.2 μm away from the a.z. Finally, the more distant region (boxed with a white dotted line) occupied an area corresponding to the distance interval from 0.2 μm to 0.3 μm. The total number of synaptic vesicles contained in each bouton was also quantified (D). Scale bar, 200 nm. E, Electron microscopy images of S-type boutons over the soma of HMNs from neonatal rats following incubation of brainstem slices in aCSF alone (control) or supplemented with either H-1152 or with H-1152 plus ML-7. Scale bar: 200 nm (applies to all panels). F, Quantitative changes in the number of synaptic vesicles (expressed as percentage change from control) contained in each spatial compartment after treatment with the indicated drugs. Histogram bins indicate distances from the a.z. as indicated in the legend. G, Histogram showing the linear density of docked synaptic vesicles per 100 nm a.z. under the indicated conditions. *p < 0.05, one-way ANOVA, post hoc Tukey's test.
Figure 7.
Figure 7.
Inhibition of ROCK activity reduces GABAergic transmission by a presynaptic mechanism. A, Pharmacological profile of eIPSCs in HMNs. To isolate chloride-dependent eIPSCs, pipettes were filled with a high-chloride internal solution and recordings were performed in the presence of 20 μm NBQX, 50 μm APV, and 30 μm d-tubocurarine. eIPSCs were evoked from a holding potential of −70 mV via electrical stimulation of the VLRF and pharmacologically dissected into its composite subtypes. The relative contribution of glycine- versus GABAA-receptor-mediated components to eIPSCs was determined by addition of the selective receptor antagonists strychnine (1 μm) and bicuculline (10 μm), respectively. Traces show averaged eIPSCs (each an average of 10 responses) recorded from an HMN before (thick black) and after superperfusion first with strychnine (blue) and then with control aCSF (wash; thin black), followed by bath application of bicuculline (red), and finally after coaddition of strychnine (green). B, Superimposition of averaged eIPSCsGABA from an HMN recorded before (black), following a 10 min exposure to H-1152 (blue), and after 10 min of wash with drug-free solution (red). C, Summary data showing the changes in eIPSCsGABA peak amplitude induced by H-1152 (n = 10 HMNs). D, Examples of eIPSCsGABA evoked by paired-pulse stimulation of VLRF axons (interpulse interval 50 ms) in an HMN recorded before (black), during (blue), and after washout of H-1152 (red). The rightmost trace shows the superimposition of the responses scaled to the peak of the first eIPSCsGABA. E, Summary histogram of changes in PPR of eIPSCsGABA induced by H-1152 (n = 10 HMNs). *p < 0.05, one-way ANOVA for repeated measures.
Figure 8.
Figure 8.
Acute inhibition of endogenous ROCK signaling in the HN attenuates XIIth nerve burst activity in adult rats. A, Confocal photomicrograph taken from a selected region of the HN showing dual immunofluorescence for the synaptic marker synaptophysin (syn; green) in combination with ROCKα (red). HMNs were retrogradely labeled with the tongue-injected fluorescent tracer FluoroGold (FG; blue). Asterisk marks motoneuron shown in B. Scale bar, 50 μm. B, C, Confocal images of HMNs retrogradely labeled with FG in sections double-immunostained for syn and either ROCKα (B) or ROCKβ (C). Arrows indicate examples of syn-immunoreactive puncta with colocalized immunofluorescence for each ROCK isoform. Scale bars: B, 15 μm; C, 10 μm. D, E, High-magnification series of confocal sections collected with z-steps of 0.5 μm showing colocalization of ROCKα (D) or ROCKβ (E) with syn in presynaptic terminals around HMN cell bodies. The bottom-rightmost panels depict the superposition of all the single confocal sections from each series. Scale bars: D, 1 μm; E, 2 μm. F, Integrated XIIth nerve inspiratory activity recorded bilaterally in an anesthetized adult rat before and 5.5 min after unilateral microinjection of H-1152 into the HN. H-1152 (2 nmol) or Y-27632 (5 nmol) were locally ejected from glass microelectrodes into the HN using pressure microinjection. Bipolar silver electrodes implanted on the XIIth nerve were used for recording whole XIIth nerve activity ipsilaterally and contralaterally to the injection site. Integrated burst activity was generated from the raw electroneurographic recordings. Analysis of burst activity in neurograms was performed on the integrated XIIth nerve signal. G, Time course of the ratio between the area of the synchronic bursts recorded in the injected versus the contralateral (noninjected) sides measured on the integrated XIIth nerve discharge before and after central microinjections of the indicated drugs. Taking as reference the integrated activity from the noninjected control side, H-1152 induced a decrease in the activity recorded ipsilaterally to the injected side, whereas ML-7 induced an increase. Horizontal black and gray lines indicate the timing of injections. H, Summary of the effects of vehicle (PBS; n = 11 injections), H-1152 (n = 3 injections in 3 rats), Y-27632 (n = 6 injections in 4 rats), and ML-7 (n = 6 injections in 3 rats) on the burst area ratio between the injected and control sides obtained when maximal effect was observed (expressed as percentage variation from the control side). *p < 0.05, Mann–Whitney U test.
Figure 9.
Figure 9.
Proposed mechanism by which baseline ROCK activity maintains synaptic strength. Endogenous ROCK signaling, by direct and/or indirect phosphorylation, activates PAK1–3, which through an inhibitory phosphorylation directly keeps MLCK in an inhibited state. Subsequently, MLCK inactivation promotes dephosphorylation of MLC and thus slows or arrests contractility of the actomyosin structure. Stabilization of the actomyosin cytoskeleton would be required to maintain the spatial distribution of vesicles within the presynaptic terminal and the size of the RRP of synaptic vesicles. Inhibition of basal ROCK signaling leads to enhanced MLC phosphorylation, contraction of the actomyosin apparatus, and reduction of the size of the RRP of synaptic vesicles, which results in short-term depression of synaptic transmission and in attenuation of AMPAR and GABAA-receptor-mediated postsynaptic currents (PSCs). Pharmacological suppression of endogenous ROCK activity with either H-1152 or Y-27632 directly or indirectly promotes PAK1–3 dephosphorylation and inactivation. This latter event, in turn, relieves p-PAK1–3-mediated inhibition of MLCK, leading to enhanced MLC phosphorylation. Inhibition of MLCK with ML-7 suppresses the effects of ROCK inhibitors on the phosphorylation level of MLC and on synaptic strength.

References

    1. Amano M, Nakayama M, Kaibuchi K. Rho-kinase/ROCK: A key regulator of the cytoskeleton and cell polarity. Cytoskeleton. 2010;67:545–554. - PMC - PubMed
    1. Anliker B, Chun J. Cell surface receptors in lysophospholipid signaling. Semin Cell Dev Biol. 2004;15:457–465. - PubMed
    1. Bähler M, Greengard P. Synapsin I bundles F-actin in a phosphorylation-dependent manner. Nature. 1987;326:704–707. - PubMed
    1. Benarroch EE. Rho GTPases: role in dendrite and axonal growth, mental retardation, and axonal regeneration. Neurology. 2007;68:1315–1318. - PubMed
    1. Burridge K, Wennerberg K. Rho and Rac take center stage. Cell. 2004;116:167–179. - PubMed

Publication types

MeSH terms

Substances

LinkOut - more resources