. 2012 Jan 4;32(1):99-110.
doi: 10.1523/JNEUROSCI.4565-11.2012.

Afadin, a Ras/Rap effector that controls cadherin function, promotes spine and excitatory synapse density in the hippocampus

Affiliations

Afadin, a Ras/Rap effector that controls cadherin function, promotes spine and excitatory synapse density in the hippocampus

Gerard M J Beaudoin 3rd et al. J Neurosci. .

Abstract

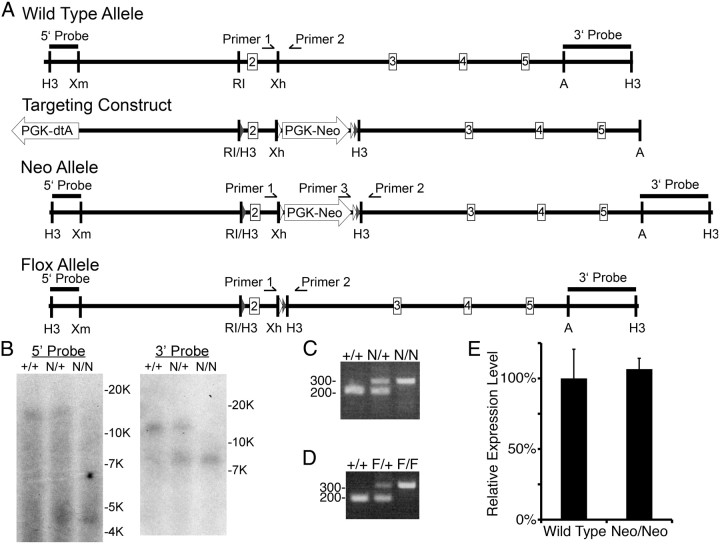
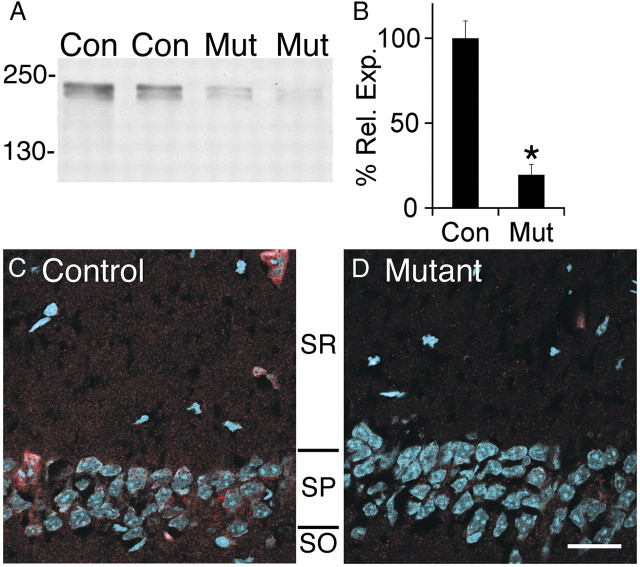
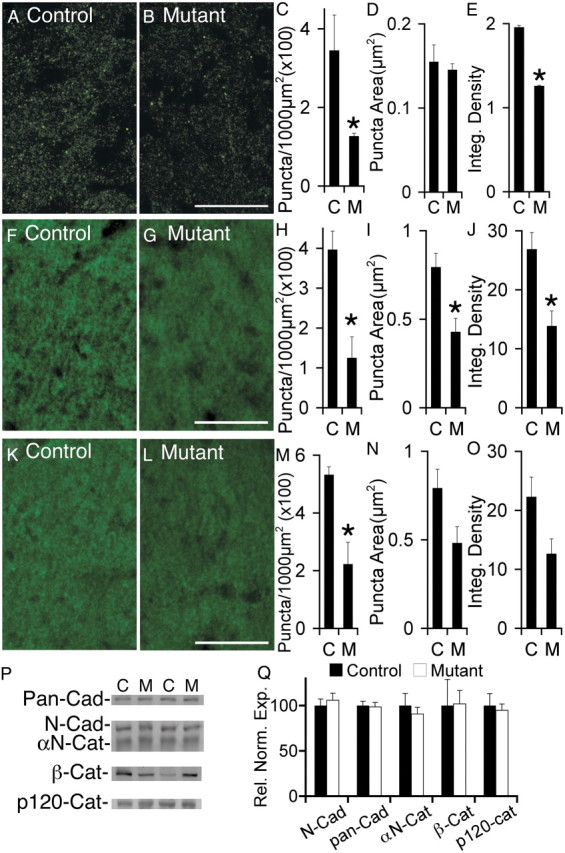
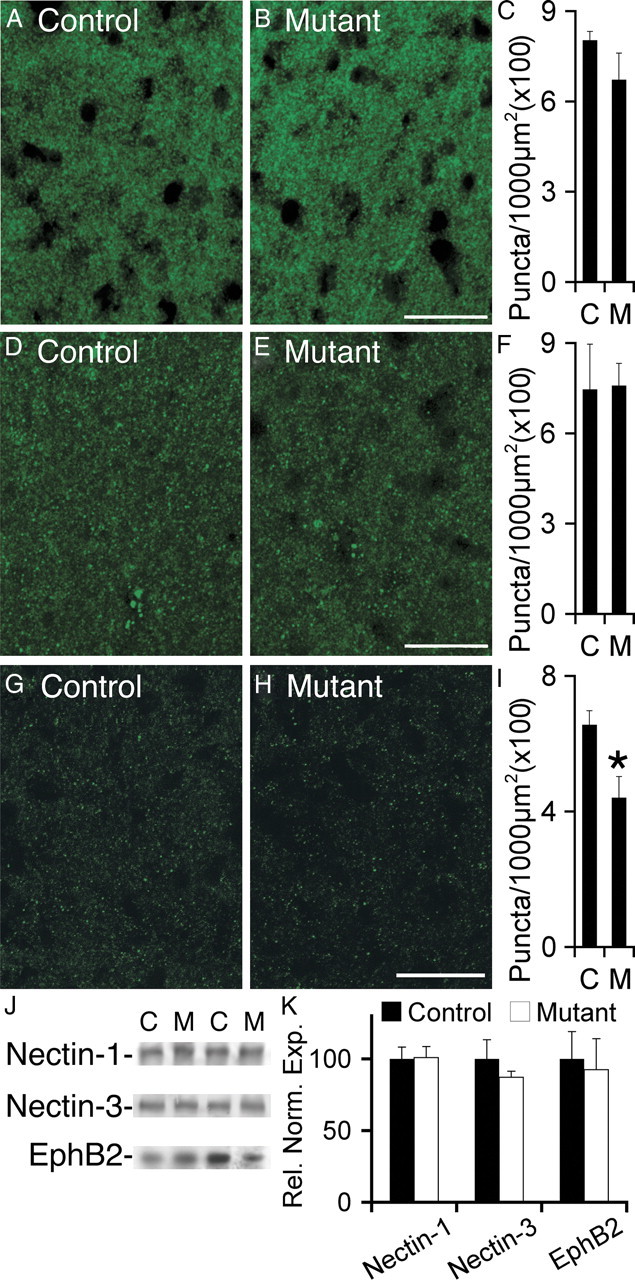
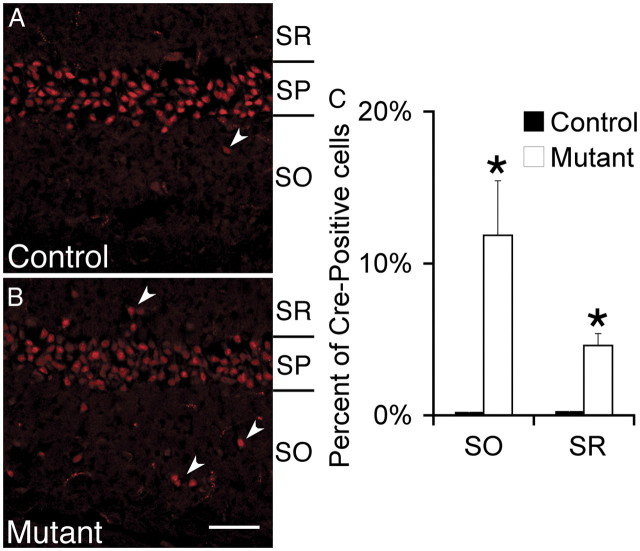
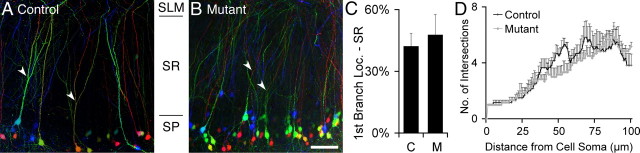
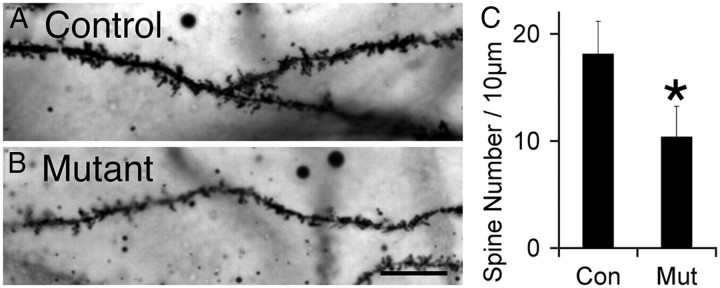
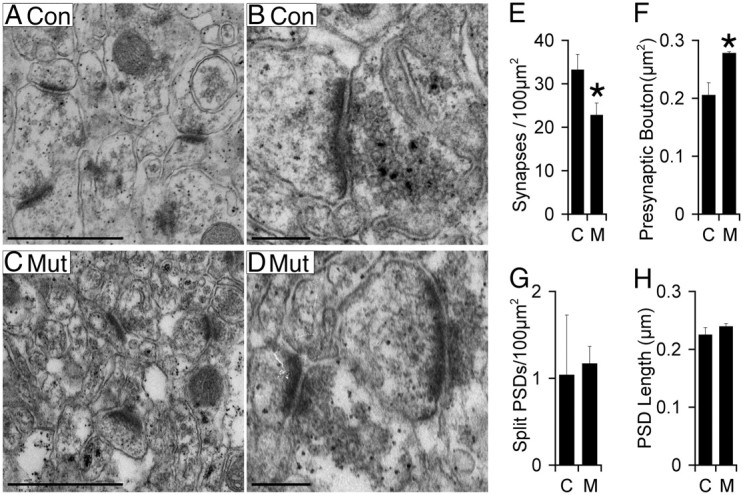
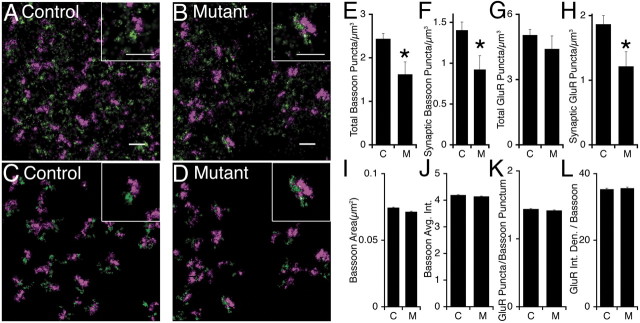
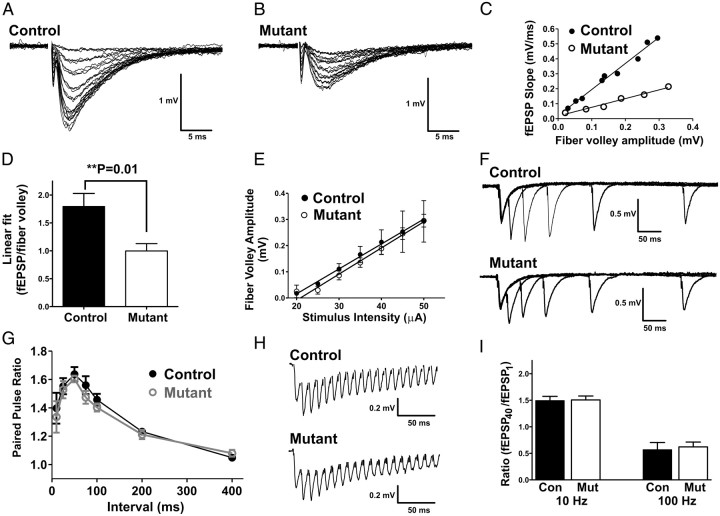
Many molecules regulate synaptogenesis, but intracellular signaling pathways required for their functions are poorly understood. Afadin is a Rap-regulated, actin-binding protein that promotes cadherin complex assembly as well as binding many other cell adhesion molecules and receptors. To examine its role in mediating synaptogenesis, we deleted afadin (mllt1), using a conditional allele, in postmitotic hippocampal neurons. Consistent with its role in promoting cadherin recruitment, afadin deletion resulted in 70% fewer and less intense N-cadherin puncta with similar reductions of β-catenin and αN-catenin puncta densities and 35% reduction in EphB2 puncta density. Its absence also resulted in 40% decreases in spine and excitatory synapse densities in the stratum radiatum of CA1, as determined by morphology, apposition of presynaptic and postsynaptic markers, and synaptic transmission. The remaining synapses appeared to function normally. Thus, afadin is a key intracellular signaling molecule for cadherin recruitment and is necessary for spine and synapse formation in vivo.


Figures

Figure 1.
Figure 1.
Creation of a conditional null allele of afadin (mllt-4). A, Schematics from top to bottom of the WT allele, Targeting construct, Neo allele, and flox allele. The WT allele is a schematic of the WT afadin (mllt-4) genomic allele depicting exons 2–5 and important restriction enzyme recognition sites. The targeting construct shows the location of the inserted loxP sites (gray triangles), flpE sites (white triangles), PGK–Neo, and PGK–dtA. The Neo allele depicts the afadin locus after homologous recombination with the targeting construct. The locations of the loxP and Flp sites and PGK–Neo cassette are shown. The flox allele depicts the afadin locus after Flp recombinase-mediated excision of the PGK–Neo cassette. The location of the 5′ and 3′ probes used for Southern blotting and the primers used for PCR genotyping are depicted on all relevant alleles. H3, HindIII; Xm, XmnI; RI, EcoRI; Xh, XhoI; A, ApaI. B, Southern blots using the 5′ and 3′ probes demonstrate homologous recombination of the targeting construct into the genome. HindIII digestion of the WT allele (+) results in a 13.5 kb fragment recognized by either the 5′ or 3′ probes, whereas the Neo allele (N) digested with HindIII results in a 4.5 kb fragment recognized by the 5′ probe and a 8 kb fragment by the 3′ probe. C, PCR-based genotyping of the Neo allele (N, 296 bp) compared with the WT allele (+, 188 bp), using primers 1, 2, and 3. D, PCR-based genotyping of the flox allele (F, 315 bp) compared with the WT allele (+, 188 bp), using only primers 1 and 2. E, Western blot quantification of l/s-afadin protein expression in WT and homozygous Neo mice (Neo/Neo) demonstrated no significant change in Neo allele homozygotes normalized to total protein expression. Error bars depict SD; n = 3 littermate controls and mutants.
Figure 2.
Figure 2.
Afadin expression is reduced in the hippocampus after Nex–cre-mediated deletion. A, Western blots for afadin in control (Con) and mutant (Mut) hippocampal lysates demonstrate a significant loss of both the long and short afadin isoforms. Molecular weights are listed in kilodaltons. B, Quantification of afadin protein blots in mutant (Mut) versus control (Con). Individual blots were normalized to total protein. Error bars depict SEM; *p < 0.0001; n = 6. C, D, Decreased afadin expression in mutant (D) versus control (C) demonstrated by immunocytochemical visualization of l/s-afadin (red) and nuclei (blue) in CA1–SR and CA1–SP. Scale bar, 25 μm.
Figure 3.
Figure 3.
Loss of afadin results in reduced N-cadherin puncta density without a change in total expression of cadherin, catenins, nectins, or EphB2. A, B, Visualization of N-cadherin in control (A) and mutant (B). C–E, Significant reduction in N-cadherin puncta density (C) and integrated density (F) in mutant (M) versus control (C). No significant difference was detected in puncta size, as determined by average area (D). In C–E, *p < 0.005, n = 3 littermate controls and mutants. F, G, Visualization of β-catenin in control (F) and mutant (G). H–J, Significant reduction in β-catenin puncta density (H), puncta area (I), and integrated density (J) in mutant (M) versus control (C). In H–J, *p < 0.02. K, L, Visualization of αN-catenin in control (K) and mutant (L). M–O, Significant reduction in αN-catenin puncta density (M) in mutant (M) versus control (C). No significant differences were detected in puncta size (N) or integrated density (O). In M, *p < 0.05. In H–J and M–O, n = 4 littermate controls and mutants. P, Protein blot analyses of cadherin and catenin expression in hippocampal lysates from control (C) and mutant (M) demonstrated no significant changes. Shown are representative lanes from blots using anti-pan-cadherin (Pan-Cad), anti-N-cadherin (N-Cad), anti-αN-catenin (αN-Cat), anti-β-catenin (β-Cat), and anti-p120–catenin. Q, Quantification of blots for cadherin and catenin protein expression in mutant versus control. Blots were normalized to total protein. n = 4 controls, 5 mutants. Scale bars, 20 μm. Error bars depict SEM.
Figure 4.
Figure 4.
Loss of afadin results in reduced EphB2 puncta density without a change in nectin-1 or nectin-3 puncta density or total expression of nectins and EphB2. A–C, Visualization of nectin-1 in control (A) and mutant (B) demonstrated no significant reduction in puncta density (C) in mutant (M) versus control (C). D–F, Visualization of nectin-3 in control (D) and mutant (E) demonstrated no significant reduction in puncta density (F) in mutant (M) versus control (C). G–I, Visualization of EphB2 in control (G) and mutant (H) demonstrated a significant (*p < 0.05) reduction in puncta density (I) in mutant (M) versus control (C). In C, F, and I, n = 4 littermate controls and mutants. J, Blot analyses in hippocampal lysates from control (C) and mutant (M) demonstrated no significant changes in nectin-1, nectin-3, or EphB2 expression levels. Shown are representative lanes from blots for nectin-1, nectin-3, and EphB2. K, Quantification of blots for nectin-1, nectin-3, and EphB2 in mutant versus control. Blots were normalized to β-tubulin or total protein expression. For nectin-1 and nectin-3, n = 4 controls, 5 mutants; for EphB2, n = 6 controls, 5 mutants. Scale bars, 20 μm. Error bars depict SEM.
Figure 5.
Figure 5.
Localization of hippocampal CA1 pyramidal cells after Nex–cre-mediated deletion of afadin. A, B, Loss of afadin results in mislocalization of ∼15% of cre-expressing neurons. In the control (A, afadinF/+; Nex–cre), these neurons are exclusively localized to the SP. In the mutant (B, afadinF/F; Nex–cre), 15% are found in the adjacent SO and SR layers. Neurons were identified by expression of cre recombinase. Scale bar, 50 μm. C, Quantification of the percentage of Cre-expressing cells in the SO and SP in controls (white bars) and mutants (black bars). Error bars depict SD. *p < 0.05, n = 3 littermate controls and mutants.
Figure 6.
Figure 6.
Analysis of dendritic branching in the Nex–cre; afadin mutant. A, B, The location of the bifurcation of the apical dendrite (arrowhead) of Thy1–YFP–H-labeled, CA1 pyramidal cells was analyzed in control (A) and Nex–cre mutant (B) relative to the thickness of the SR. The image stack was pseudocolored by depth before performing a maximal z-projection. Scale bar, 50 μm. C, Average position of the first bifurcation of the apical dendrite relative to the thickness of the SR demonstrated no significant difference between control (C) and mutant (M). Error bars depict SD. n ≥ 60 neurons analyzed from 3 mice. D, Scholl analysis revealed no difference in complexity of the dendritic tree between control and mutant mice. Error bars depict SEM. n = 6 neurons from 3 littermate controls and mutants.
Figure 7.
Figure 7.
Reduced spine density on pyramidal cell dendrites in CA1 SR in the afadin mutant. A, B, Representative Golgi-stained images of spine densities in mutant (B) and control (A). Scale bar, 10 μm. C, Quantification of spine densities in control (Con) and mutant (Mut). Error bars depict SD. *p < 0.05, n = 3.
Figure 8.
Figure 8.
Reduced synapse density in CA1–SR in the afadin mutant. A–D, Images of synapses in control (A, C) and mutant (B, D). Scale bars: A, C, 1 μm; B, D, 0.25 μm. E–H, Significant reduction in synapse density (E) in mutant (M) versus control (C). In addition, presynaptic bouton area (F) is significantly increased in mutant (M) versus control (C). No significant differences between control and mutant were seen in the density of split PSDs (G) or average length of the PSD (H). Error bars depict SD. *p < 0.05, n = 3.
Figure 9.
Figure 9.
STORM demonstrates loss of synapses in mutants. A, B, Original high-resolution STORM image from a control (A) and mutant (B) showing puncta of bassoon (purple) and glutamate receptor 1/2 (green). Scale bar, 1 μm. C, D, STORM image from a control (C) and mutant (D) masked to show only the apposed bassoon and AMPA glutamate receptor 1/2 puncta. E–H, Average puncta density is significantly reduced in mutants (M) versus controls (C) for all bassoon puncta (E), bassoon puncta apposed to a glutamate receptor puncta (F), and glutamate receptor puncta apposed to a bassoon puncta (G). There was not a statistically significant reduction in total AMPA glutamate receptor (GluR1/2) puncta (H) (p = 0.19). n = 6 control, 7 mutant. Error bars are SEM. *p < 0.005. I–K, Unlike puncta density, controls and mutants had changes <5% in average synaptic bassoon size (I), average synaptic bassoon intensity (J), average number of glutamate receptor puncta per bassoon punctum (K), and average total glutamate receptor integrated density per bassoon punctum (L). n > 8500 puncta per genotype. Error bars are SEM.
Figure 10.
Figure 10.
Reduced excitatory synaptic transmission in the mutant hippocampus. Recordings of fEPSPs in CA1 from control (A) and mutant (B) mice. Traces of field potential responses to increasing evoked stimulus intensity by 5 μA every three sweeps; range, 20–50 μA. C, The linear fit of the fEPSP rise slope (millivolts per milliseconds) to fiber volley amplitude (millivolts) plot demonstrates reduced synaptic strength in mutant mice; the data in the histogram plot in D is the average across multiple animals (n = 5) and shows that synaptic strength in mutant animals (slope, 1.0 ± 0.1) is significantly reduced compared with control (slope, 1.8 ± 0.2). E, Fiber volley amplitudes evoked by a range of stimulus intensities were not different between control and mutant. Paired-pulse responses of fEPSPs (F, G) in control and mutant were measured at intervals of 10, 25, 50, 75, 100, 200, and 400 ms and were not statistically different. H, Examples of traces of fEPSP responses to 40 stimuli pulses delivered at 100 Hz. I, Summary histogram of fEPSP responses to 40 stimuli pulses delivered at 10 or 100 Hz. The ratios of the fEPSP rise slope of the 40th pulse to the first pulse were not significantly different between control and mutant at either frequency.

References

    1. Abe K, Chisaka O, Van Roy F, Takeichi M. Stability of dendritic spines and synaptic contacts is controlled by alpha N-catenin. Nat Neurosci. 2004;7:357–363. - PubMed
    1. Bamji SX, Shimazu K, Kimes N, Huelsken J, Birchmeier W, Lu B, Reichardt LF. Role of beta-catenin in synaptic vesicle localization and presynaptic assembly. Neuron. 2003;40:719–731. - PMC - PubMed
    1. Beaudoin GM., 3rd Con-nectin axons and dendrites. J Cell Biol. 2006;174:7–9. - PMC - PubMed
    1. Biswas S, Emond MR, Jontes JD. Protocadherin-19 and N-cadherin interact to control cell movements during anterior neurulation. J Cell Biol. 2010;191:1029–1041. - PMC - PubMed
    1. Buchert M, Schneider S, Meskenaite V, Adams MT, Canaani E, Baechi T, Moelling K, Hovens CM. The junction-associated protein AF-6 interacts and clusters with specific Eph receptor tyrosine kinases at specialized sites of cell-cell contact in the brain. J Cell Biol. 1999;144:361–371. - PMC - PubMed

Publication types

MeSH terms