. 2012 Jan 4;32(1):243-53.
doi: 10.1523/JNEUROSCI.4792-11.2012.

EEG-guided transcranial magnetic stimulation reveals rapid shifts in motor cortical excitability during the human sleep slow oscillation

Affiliations

EEG-guided transcranial magnetic stimulation reveals rapid shifts in motor cortical excitability during the human sleep slow oscillation

Til O Bergmann et al. J Neurosci. .

Abstract

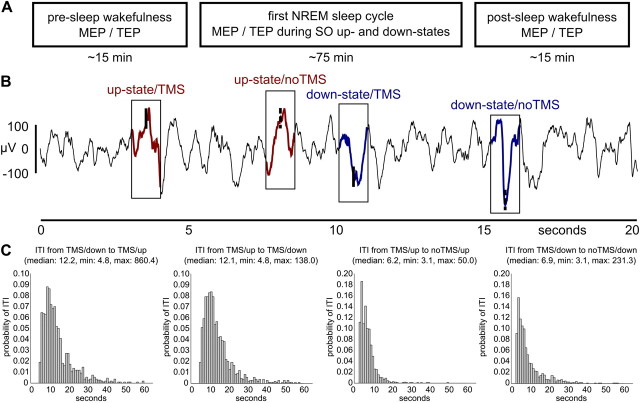
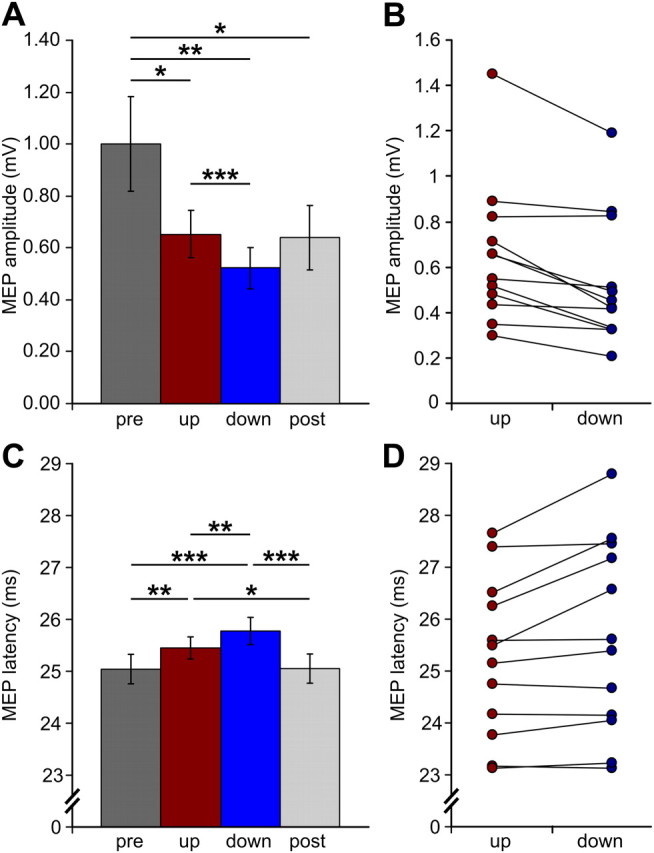
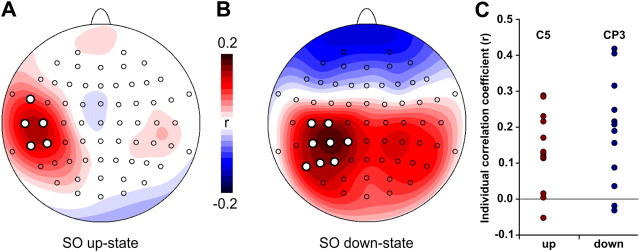
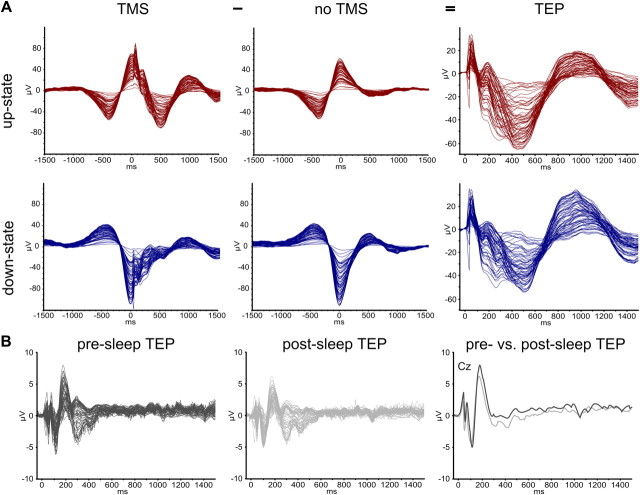
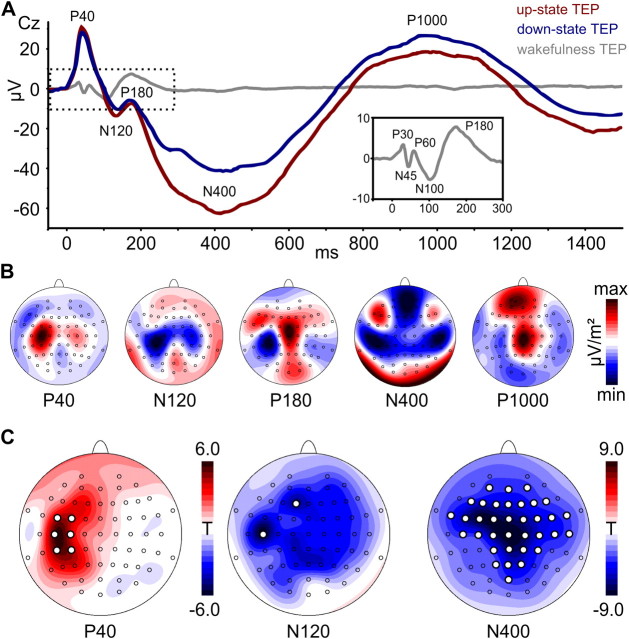
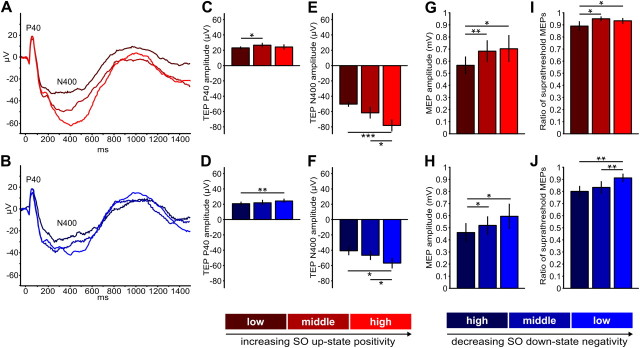
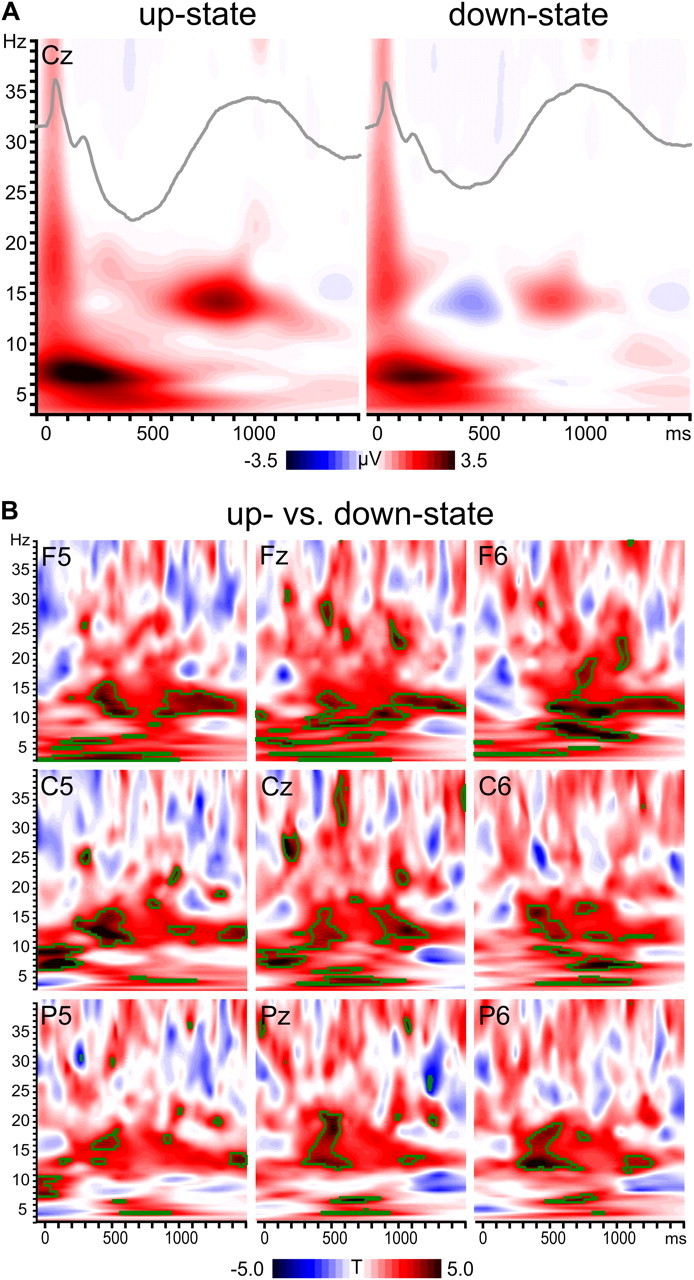
Evoked cortical responses do not follow a rigid input-output function but are dynamically shaped by intrinsic neural properties at the time of stimulation. Recent research has emphasized the role of oscillatory activity in determining cortical excitability. Here we employed EEG-guided transcranial magnetic stimulation (TMS) during non-rapid eye movement sleep to examine whether the spontaneous <1 Hz neocortical slow oscillation (SO) is associated with corresponding fluctuations of evoked responses. Whereas the SO's alternating phases of global depolarization (up-state) and hyperpolarization (down-state) are clearly associated with fluctuations in spontaneous neuronal excitation, less is known about state-dependent shifts in neocortical excitability. In 12 human volunteers, single-pulse TMS of the primary motor cortical hand area (M1(HAND)) was triggered online by automatic detection of SO up-states and down-states in the EEG. State-dependent changes in cortical excitability were traced by simultaneously recording motor-evoked potentials (MEPs) and TMS-evoked EEG potentials (TEPs). Compared to wakefulness and regardless of SO state, sleep MEPs were smaller and delayed whereas sleep TEPs were fundamentally altered, closely resembling a spontaneous SO. However, both MEPs and TEPs were consistently larger when evoked during SO up-states than during down-states, and amplitudes within each SO state depended on the actual EEG potential at the time and site of stimulation. These results provide first-time evidence for a rapid state-dependent shift in neocortical excitability during a neuronal oscillation in the human brain. We further demonstrate that EEG-guided temporal neuronavigation is a powerful tool to investigate the phase-dependent effects of neuronal oscillations on perception, cognition, and motor control.


Figures

Figure 1.
Figure 1.
Experimental time line and example data. A, MEPs (EMG at the contralateral hand) and TEPs (64-channel EEG) were acquired for SO up- and down-states during first NREM sleep cycle as well as during pre-sleep and post-sleep wakefulness. B, An adaptive thresholding algorithm automatically detected up- and down-states of the slow oscillation during NREM sleep. TMS was triggered by every second event (TMS), whereas the others were left unstimulated as a baseline (noTMS). An example EEG data strip (channel C3) is shown containing all four event types. C, Histograms show relative frequencies (1 s bins) of the relevant intertrial intervals (ITI), and the corresponding descriptive statistics. Note that the few delays lasting even longer than 60 s are not included in the histograms for the sake of visibility. min, Minimum; max, maximum.
Figure 2.
Figure 2.
Motor-evoked potentials. A, C, Group averages of MEP amplitudes and latencies (± SEM) for TMS stimulation during the up-state (red) and down-state (blue) of the sleep slow oscillation as well as for pre-sleep (dark gray) and post-sleep (light gray) wakefulness. Asterisks indicate significant comparisons: *p < 0.05, **p < 0.01, ***p < 0.001. B, D, Individual MEP amplitudes and latencies for SO up- and down-states for all subjects.
Figure 3.
Figure 3.
A, B, Single-trial correlations between SO amplitude (directly before TMS) and MEP amplitude (log transformed) for SO up-states (A) and SO down-states (B). MEP amplitude depended on the current EEG potential in the left sensorimotor cortex. The more depolarized the larger the MEP (up-state) and the more hyperpolarized, the smaller the MEP (down-state). Colors represent group-averaged correlation coefficients ranging from 0.2 (red) to −0.2 (blue) for each electrode. White dots indicate correlations significant at pcorr < 0.05. C, Individual correlation coefficients for peak electrodes C5 (up-state) and CP3 (down-state).
Figure 4.
Figure 4.
Butterfly diagrams. A, Grand averages of detected slow oscillations for all experimental conditions and calculation of TEPs. The figure shows butterfly diagrams (all channels superimposed; TMS artifacts removed) time locked to the TMS-pulse (at 0 ms) for SO up-states (top row, red) and SO down-states (bottom row, blue) that had either been stimulated (TMS, left column) or merely detected (noTMS, middle column), as well as the respective subtraction of both, i.e., the actual response to TMS without the underlying endogenous oscillation (TEP, right column). Note that scaling is increased for the latter. B, Grand average TEPs from pre-sleep (left, dark gray) and post-sleep (middle panel, light gray) measurements as well as a superposition of representative channel Cz for both (right panel). Wake TEPs are of much smaller amplitude than sleep TEPs (different scaling), but note the different stimulation intensities as well (see Materials and Methods).
Figure 5.
Figure 5.
TMS-evoked potentials. A, Group-averaged TEPs in representative channel Cz for TMS stimulation during SO up-states (red), SO down-states (blue), and wakefulness (gray). The wake TEP is shown for visual comparison with the inset depicting an enlarged version of the dotted area for better visibility (averaged across pre-sleep and post-sleep measures). TEP components are labeled according to their polarity and approximate latency. Note the striking difference between the SO-like sleep TEPs and the typical high-frequency wake TEP. B, Scalp current source density (CSD) maps for the most pronounced sleep TEP components (averaged across SO states; high-pass filtered for P40, N120, and P180). Maps are scaled individually according to their respective minimum (blue) and maximum (red) CSD values (μV/m2). C, Statistical maps depict color-coded t values from electrode-wise amplitude comparisons (SO up-state minus down-state) of individual TEP components. White dots indicate differences significant at pcorr < 0.05 (no significant channels were revealed for P180 and P1000). See Materials and Methods for details.
Figure 6.
Figure 6.
TEPs and MEPs depend on the actual SO potential at channel C5 at the time of stimulation. Trials were binned into three different levels of SO up-state positivity (red shades) and SO down-state negativity (blue shades), respectively (see Materials and Methods). A, B, Grand average TEP waveforms. Bar charts depict average (±SEM) C, D, TEP P40 amplitudes. E, F, TEP N400 amplitudes. G, H, MEP amplitudes. I, J, Ratios of suprathreshold MEPs. TEP and MEP amplitudes were individually determined (see Materials and Methods; compare Fig. 5) and averaged per bin. Asterisks indicate significant comparisons: *p < 0.05, **p < 0.01, ***p < 0.001.
Figure 7.
Figure 7.
TMS-induced oscillations. A, Group averaged time–frequency plots (instantaneous amplitude) depict TIOs after subtraction of the endogenous SO for SO up- and down-states in representative channel Cz. Inserted TEPs (gray lines) illustrate the relation to the TEP time course. Note that spindle activity (12–16 Hz) is grouped within the positive phase of the evoked slow potential. B, Time–frequency plots (statistical t values) contrasting both states for a representative selection of channels. Green outlines indicate significant clusters (p < 0.01, two-sided).

References

    1. Achermann P, Borbély AA. Low-frequency (<1 Hz) oscillations in the human sleep electroencephalogram. Neuroscience. 1997;81:213–222. - PubMed
    1. Avesani M, Formaggio E, Fuggetta G, Fiaschi A, Manganotti P. Corticospinal excitability in human subjects during nonrapid eye movement sleep: single and paired-pulse transcranial magnetic stimulation study. Exp Brain Res. 2008;187:17–23. - PubMed
    1. Bergmann TO, Mölle M, Marshall L, Kaya-Yildiz L, Born J, Siebner RH. A local signature of LTP- and LTD-like plasticity in human NREM sleep. Eur J Neurosci. 2008;27:2241–2249. - PubMed
    1. Bertini M, Ferrara M, De Gennaro L, Curcio G, Fratello F, Romei V, Pauri F, Rossini PM. Corticospinal excitability and sleep: a motor threshold assessment by transcranial magnetic stimulation after awakenings from REM and NREM sleep. J Sleep Res. 2004;13:31–36. - PubMed
    1. Boly M, Balteau E, Schnakers C, Degueldre C, Moonen G, Luxen A, Phillips C, Peigneux P, Maquet P, Laureys S. Baseline brain activity fluctuations predict somatosensory perception in humans. Proc Natl Acad Sci U S A. 2007;104:12187–12192. - PMC - PubMed

Publication types

LinkOut - more resources