. 2012 Feb 1;188(3):1421-30.
doi: 10.4049/jimmunol.1101647. Epub 2012 Jan 4.

Difference in Th1 and Th17 lymphocyte adhesion to endothelium

Affiliations

Difference in Th1 and Th17 lymphocyte adhesion to endothelium

Pilar Alcaide et al. J Immunol. .

Abstract

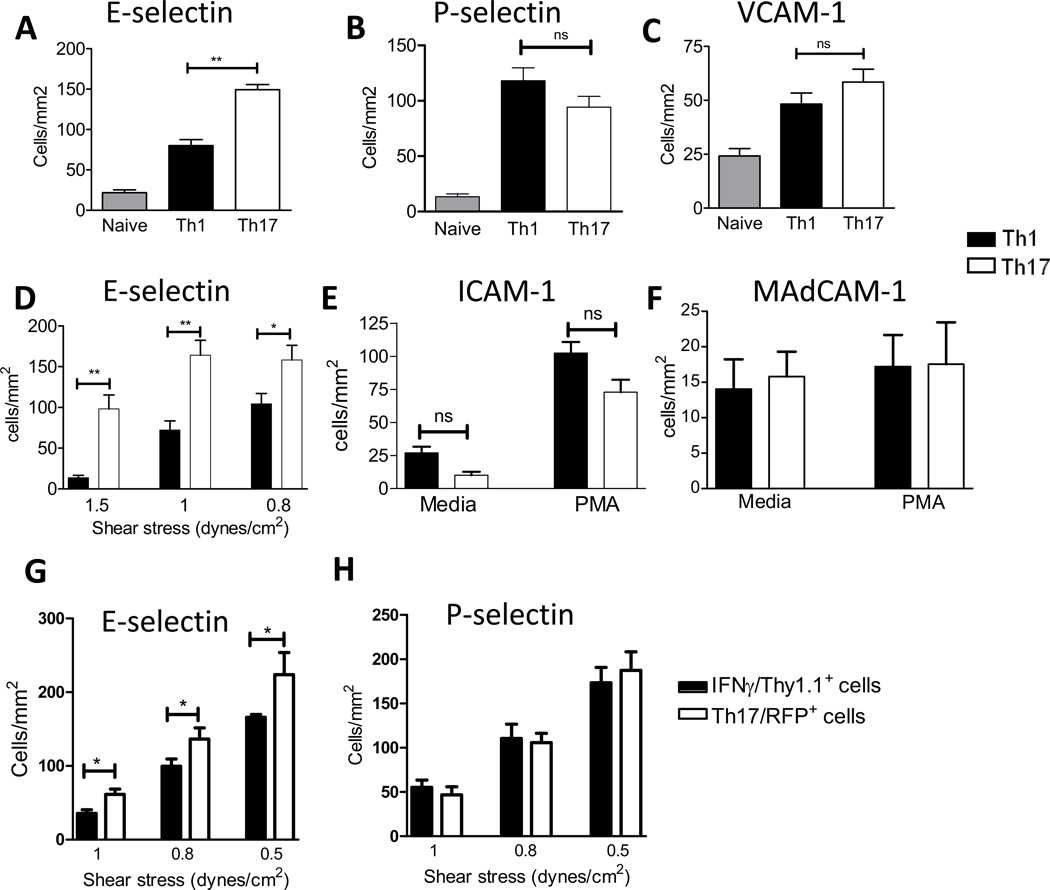
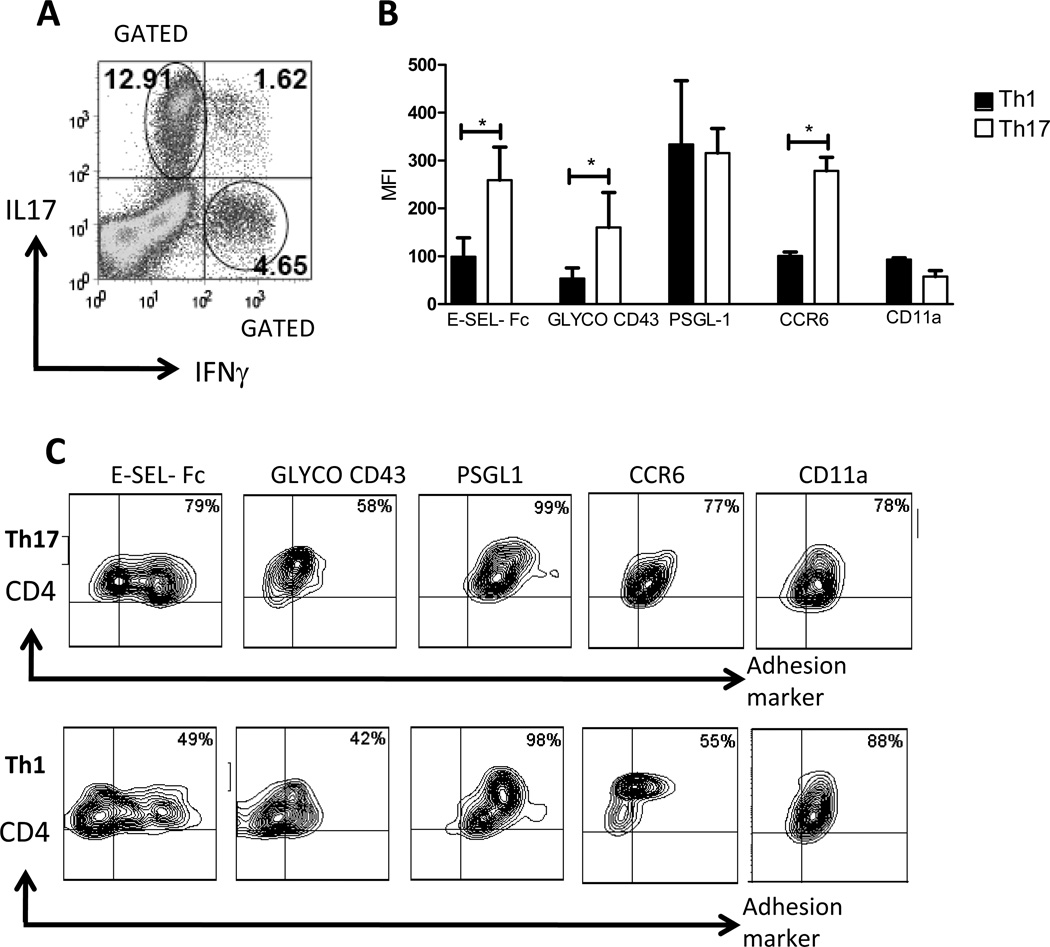
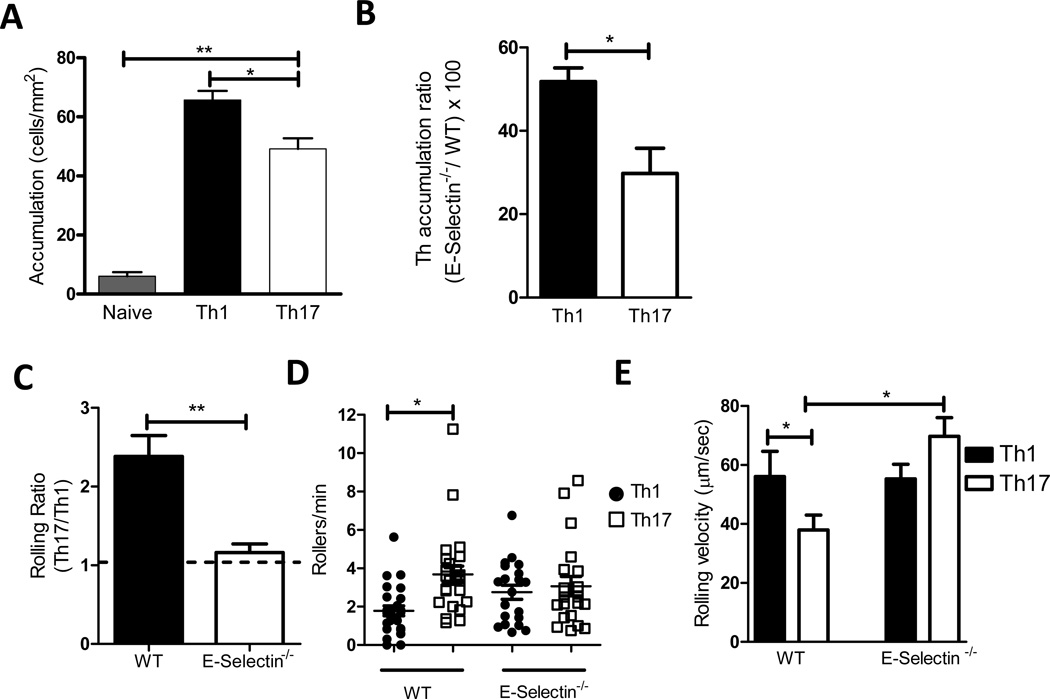
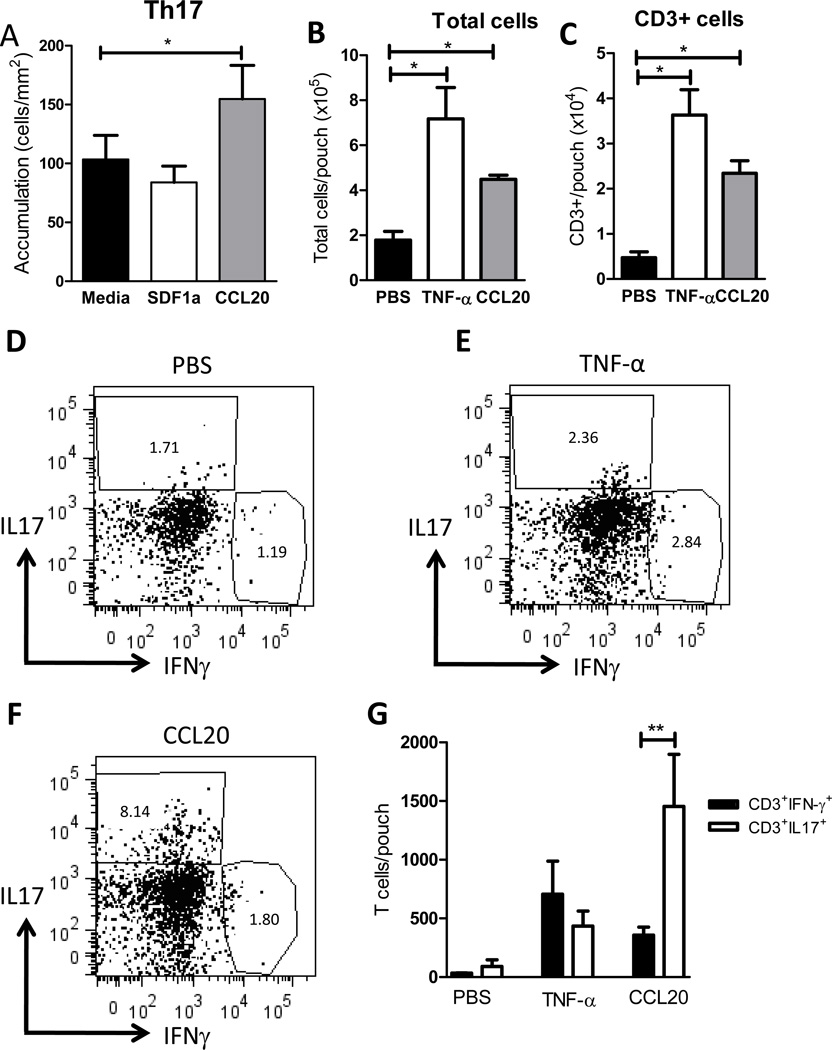
T cell subset-specific migration to inflammatory sites is tightly regulated and involves interaction of the T cells with the endothelium. Th17 cells often appear at different inflammatory sites than Th1 cells, or both subsets appear at the same sites but at different times. Differences in T cell subset adhesion to endothelium may contribute to subset-specific migratory behavior, but this possibility has not been well studied. We examined the adhesion of mouse Th17 cells to endothelial adhesion molecules and endothelium under flow in vitro and to microvessels in vivo and we characterized their migratory phenotype by flow cytometry and quantitative RT-PCR. More Th17 than Th1 cells interacted with E-selectin. Fewer Th17 than Th1 cells bound to TNF-α-activated E-selectin-deficient endothelial cells, and intravital microscopy studies demonstrated that Th17 cells engage in more rolling interactions with TNF-α-treated microvessels than Th1 cells in wild-type mice but not in E-selectin-deficient mice. Th17 adhesion to ICAM-1 was dependent on integrin activation by CCL20, the ligand for CCR6, which is highly expressed by Th17 cells. In an air pouch model of inflammation, CCL20 triggered recruitment of Th17 but not Th1 cells. These data provide evidence that E-selectin- and ICAM-1-dependent adhesion of Th17 and Th1 cells with endothelium are quantitatively different.


Figures

Figure 1
Figure 1
Phenotype of in vitro differentiated T cell populations. Naïve CD4+ T cells isolated from the spleen and lymph nodes of C57/BL6 mice were cultured under Th17 or Th1 cell induction conditions during 5 days, as described in materials and methods. A. Intracellular IFNγ and IL17A were detected in PMA plus ionomycin stimulated Th cells by flow cytometry (see methods). The dot plot data shown are representative of 12 separate cell preparations that were also used in flow chamber studies and adoptive transfer studies presented in this article. B. Th17 and Th1 cells that were differentiated for 5 days were analyzed by qRT-PCR. Results were normalized to β-actin (Actb) gene expression and relative gene expression levels are indicated. Data show the mean ± SD of 4 different experiments, ** p<0.001.
Figure 2
Figure 2. Interactions of Th17 cells with endothelial cell adhesion molecules under flow conditions
Naïve and in vitro differentiated Th1 and Th17 cells from WT mice were drawn across coverslips coated with the indicated adhesion molecules within a flow chamber at shear stress of 1 dyne/cm2 (A–C), 0.8 dynes/cm2 (E) or 0.5 dynes/cm2 (F), or at decreasing levels of shear stress (D). In vitro differentiated Th1 cells derived from splenic CD4+ T cells from Ifng/Thy1.1 BAC-In mice (22) and Th17 cells derived from IL17-RFP mice (21), were sorted to obtain 100% cytokine reporter positive cells, which were then drawn across coverslips coated with E-Selectin (G) or P-Selectin (H) at decreasing levels of shear stress. T cell interactions with the adhesion proteins were recorded with a phase contrast objective (20X) and videomicroscopy (Ed Marcus Laboratories, Boston, MA). Accumulation of T cells was determined after the initial minute of each flow rate by counting adherent cells in eight fields. Data show the mean ±SD values from 6 different experiments. **p<0.01, * p<0.05.
Figure 3
Figure 3. Expression of adhesion molecules and chemokine receptors on Th17 cells, and their chemokine-dependent interactions with ICAM-1
A–D. In vitro differentiated Th1 and Th17 cells were stimulated with PMA and ionomycin in the presence of brefeldin during 4h and stained with E-selectin-human IgG fusion protein, or the indicated E-selectin ligands (A–B), integrins or chemokine receptors (C, D) and co-stained with antibodies specific for IL17A and IFNγ. The expression levels of the indicated markers were analyzed in gated IL17+ or IFNγ+ cells by flow cytometry. Dot plot data is shown representative of 12 separate experiments using cells that were also used in flow chamber studies and adoptive transfer experiments presented in this article. B, D. Data show the mean ± SD of 10–12 different cell preparations. In vitro differentiated Th17 (E) or Th1 (F) cells treated with media or PMA (10ng/ml) for 5 minutes at 37C, were drawn across ICAM-1 coated coverslips. Media treated cells were drawn across coverslips co-coated with either SDF-1α or CCL20. The shear stress within a flow chamber was 0.8 dynes/cm2. Data show the mean ±SD values from 5 different experiments. **p<0.01,* <0.05.
Figure 4
Figure 4. Expression of adhesion molecules and chemokine receptors in Th17 cells generated in vivo
C57BL/6 mice were immunized with MOG peptide, and 8 days after immunization the cells isolated from the lymph nodes were re-stimulated with MOG peptide for 5 additional days in culture and analyzed by flow cytometry as in Fig 3. A. A representative dot plot data is shown from 6 separate experiments with similar results, and indicates the presence of in vivo generated Th17 and Th1 cells. B. The expression levels of the different adhesion molecules and chemokine receptors were analyzed by flow cytometry in the IL17+CD4+ or IFNγ+CD4+ gated populations. Data show the mean ± SD of 2–3 different experiments. C. A representative dot plot data is shown of 4 separate experiments. *p<0.05.
Figure 5
Figure 5. Th17 cells interactions with TNF-α activated mouse heart endothelial cells (MHEC) under flow conditions and with TNF-α activated cremaster muscle microvasculature in vivo
(A, B) Naïve and in vitro differentiated Th1 and Th17 cells were drawn across TNF-α activated MHEC from C57/BL6 or E-selectin deficient mice within a flow chamber at a level of shear stress of 0.8 dynes/cm2. Accumulation (A) was calculated as described in the method section. Panel B is the ratio [(Th cells accumulated on E-Selectin−/− MHEC divided by Th accumulated on WT MHEC) × 100]. Data show the mean ±SD values from 3 different experiments. C. A competitive assay was performed to compare Th17 and Th1 cells rolling on the microvasculature. Equal numbers of in vitro differentiated Th17 and Th1 cells each labeled with a different fluorescent dye, were co-injected into C57/BL6 or E-selectin−/− recipient mice that had received TNF-α injection into the scrotal sac 2h before the cells were transferred. Recordings of each vessel were analyzed for 60 s, and rolling T cells were identified as the visible cells passing through a plane perpendicular to the vessel axis. Rolling ratio represents the ratio Th17/Th1 cells that roll on each vessel. The number of Th17 and Th1 rollers per minute in several independent vessels studied are also shown (D). E. The rolling velocity of high velocity cells (Vcell) was calculated to ensure that these cells qualified as rolling leukocytes, defined Vcell<Vcrit. Velocities of Th17 and Th1 cells from 4 independent preparations (33–44 Th17 or Th1 independent cells were analyzed rolling on WT or E-Selectin−/− vessels). Data represents mean ±SD values of 4 independent experiments using independent T cell preparations, and the numbers of mice and vessels are indicated in Table I. ** p<0.01, * p<0.05.
Figure 6
Figure 6. Recruitment of Th17 and Th1 cells into the TNF-α injected air pouch
WT or E-selectin−/− mice (5 mice per group) received 500ng/ml of TNF-α into a dorsal air pouch and cell infiltrates were harvested 20h post TNF-α injection and analyzed by cell counting (A) and flow cytometry (B–F). A representative dot plot of CD3+ gated cells is shown for the TNF- α injections in WT (C) and E-Selectin−/− (D) mice. Numbers in the gate represent % positive cells (C, D). Number of CD3+ cells/pouch was calculated based on the % positive CD3 cells relative to the total number of cells harvested per pouch (B,D). E. F. Data is calculated as in C, using the % positive cells within the CD3+ region.
Figure 7
Figure 7. Th17 cell interactions with CCL20 treated MHEC and Th17 cell recruitment into CCL20 injected air pouch
A. Naïve and in vitro differentiated Th1 and Th17 cells were drawn across TNF-α activated MHEC from C57/BL6 mice that had been treated with the indicated chemokines during 20 minutes before introducing the T cells within a flow chamber at a shear stress of 0.8 dynes/cm2. Data show the mean ±SD values from 3 different experiments. B–G. WT mice (5 mice per group) received PBS, 500ng/ml of TNF-α or 400ng of CCL20 into the air pouch and cell infiltrates were harvested 24h post injection and analyzed by cell counting (B) and flow cytometry (C–G). A representative dot plot representing cells gated within the CD3+ region is shown for the PBS (D), TNF-α (E) and CCL20 (F) injections. C. Number of CD3+ cells/pouch was calculated based on the % positive CD3 cells referred to the total number of cells harvested per pouch. G. Data is calculated as in C, using the % positive cells within the CD3+ gate. **p<0.01, *p<0.05.

References

    1. Zhu J, Paul WE. CD4 T cells: fates, functions, and faults. Blood. 2008;112:1557–1569. - PMC - PubMed
    1. Harrington LE, Mangan PR, Weaver CT. Expanding the effector CD4 T-cell repertoire: the Th17 lineage. Curr. Opin. Immunol. 2006;18:349–356. - PubMed
    1. Park EJ, Mora JR, Carman CV, Chen J, Sasaki Y, Cheng G, von Andrian UH, Shimaoka M. Aberrant activation of integrin alpha4beta7 suppresses lymphocyte migration to the gut. J. Clin. Invest. 2007;117:2526–2538. - PMC - PubMed
    1. Chung Y, Yang X, Chang SH, Ma L, Tian Q, Dong C. Expression and regulation of IL-22 in the IL-17-producing CD4+ T lymphocytes. Cell Res. 2006;16:902–907. - PubMed
    1. Langrish CL, Chen Y, Blumenschein WM, Mattson J, Basham B, Sedgwick JD, McClanahan T, Kastelein RA, Cua DJ. IL-23 drives a pathogenic T cell population that induces autoimmune inflammation. J. Exp. Med. 2005;201:233–240. - PMC - PubMed

Publication types